
How Much of Your Meta Ads Data Is Real?
A typical account's reporting is 65–80% observation and 20–35% statistical inference — and no column tells you which is which. The five signal eaters quantified, the 10-minute estimate of your own modeled share, why small accounts get the foggiest data, and the protocol for trusting a blend.
Typically 65–80% observed, 20–35% modeled. The losses driving the inference layer: ~70% of iOS users opt out of tracking (their conversions arrive delayed/modeled), 25–30% run ad blockers (browser pixel never fires), 40–70% of EU visitors reject consent, Safari strips fbclid on ~25–35% of B2C traffic, and browser-only setups miss 30–50% of conversions outright. CAPI honestly recovers 15–30% (vendor '93%' case studies = selection bias). Estimate your share: iOS conversion % × 0.7 + Events Manager browser-vs-server spread. Modeling error concentrates in small, new, iOS-heavy, pixel-only accounts. Protocol: modeled numbers steer optimization; only store revenue and MER steer money; volume + signal density are your error bars.
• On a typical account, 20–35% of reported conversions are modeled — inferred by Meta's systems rather than observed via a click-to-purchase trail. • The underlying losses are real: ~70% of iOS users opt out of tracking, 25–30% of users run ad blockers, 40–70% of EU visitors reject consent, and browser-only pixels miss 30–50% of conversions outright. • CAPI recovers 15–30% in honest implementations — the 90%+ numbers in vendor case studies are selection bias, not your forecast. • Modeling error concentrates where accounts can least afford it: small, new, iOS-heavy, pixel-only setups get the most inference on the least anchor data. • You can estimate your own modeled share in 10 minutes (device split × opt-out rate + CAPI-vs-pixel comparison) — no official column exists. • Trust protocol: modeled numbers steer optimization; only observed store revenue and MER steer money.
The question behind the question
"Are these numbers even real?" stopped being paranoid around 2021 and became technical. When Apple's App Tracking Transparency put an opt-out in front of every iOS user, roughly 70% said no — and their post-click behavior went dark to conventional pixels. Meta's answer, like every platform's, was statistical modeling: infer the conversions you can no longer see from the ones you still can. In 2026 that means a typical account's reported results are a blend — a majority of observed events plus a 20–35% layer of inference — and the blend is invisible: no column says "modeled." This guide quantifies each signal eater, shows you how to estimate your own modeled share, and ends with the only trust protocol that survives contact with the numbers. (The companion problem — Meta's definitions changing under you — lives in the 2026 attribution guide; this one is about the data itself.)
The five signal eaters, quantified
The eaters stack multiplicatively, and vendor case studies quoting '93% recovery' are selection-biased — 15-30% CAPI recovery is the honest planning number.
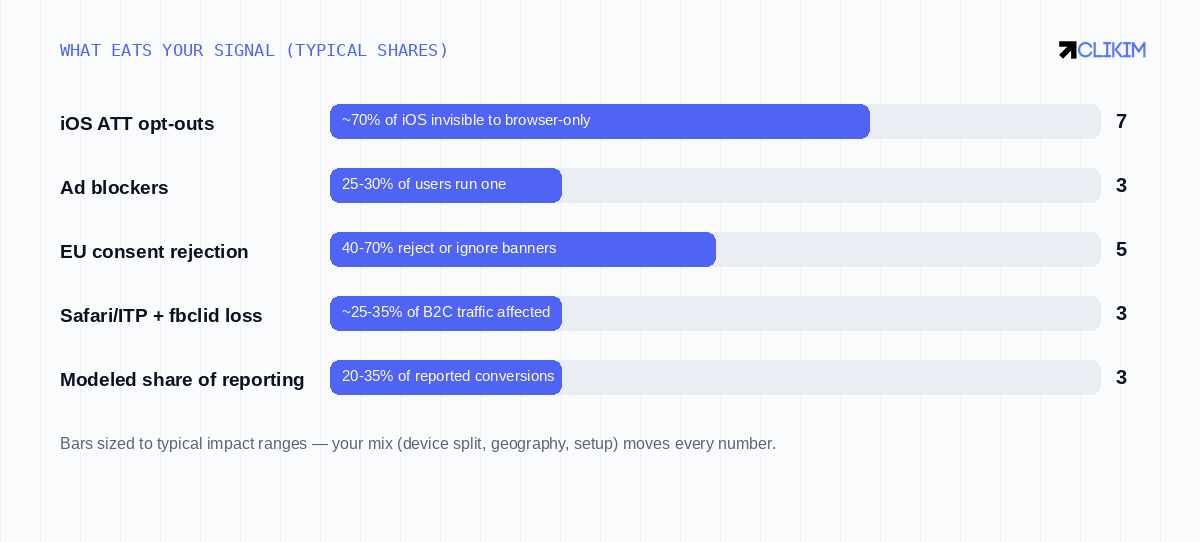
Stack the eaters against your own device mix and geography — EU + iOS + small account is maximum-fog territory.
Two of the five deserve un-vendored honesty. CAPI recovery: the Conversions API genuinely restores signal — server-side events carrying customer information parameters match users no browser event could — but the case-study numbers ("we recovered 93%!") describe stores whose tracking was catastrophically broken before. Implemented well on an already-functional setup, 15–30% more observed conversions is the realistic planning band. Server-side GTM: widely missold — if the browser event never fires (ad blocker), sGTM has nothing to relay; only true server-to-server sources (platform webhooks, CRM events) reach past the blocked browser, a distinction covered properly in this series' sGTM guide.
Estimate your own modeled share
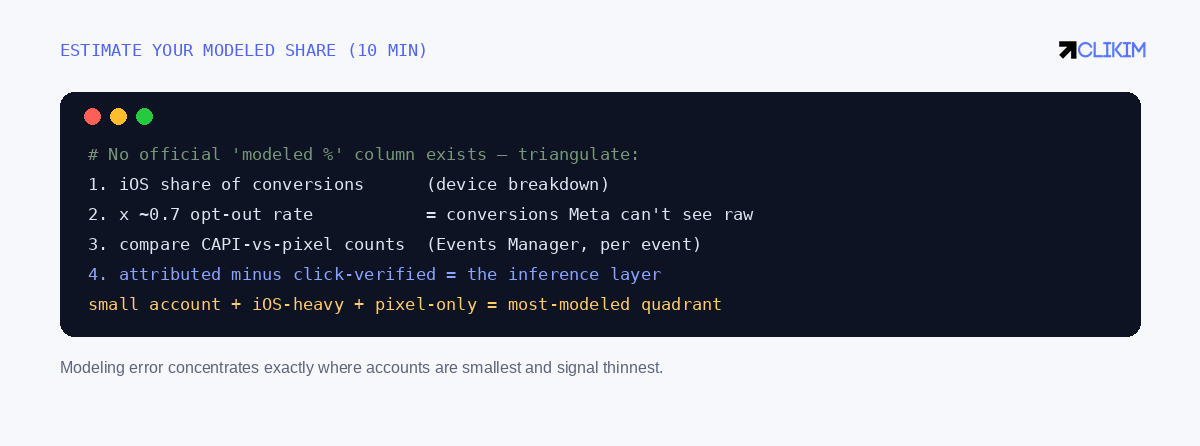
Ten minutes of triangulation — Meta publishes no 'modeled %' column, but the inputs are all in your dashboards.
Walk it with real numbers: an account reports 1,000 monthly purchases, device breakdown says 55% converted on iOS → ~550. Apply the ~70% opt-out rate: ~385 purchases Meta largely couldn't observe raw — modeled, delayed, or matched through the aggregated pipeline. Cross-check in Events Manager: if the Purchase event shows, say, 700 browser events against 950 server events, the 250-event spread maps your browser-side losses (blockers, ITP, consent). Now the honest sentence about this account: "roughly a quarter to a third of our reported purchases are inference." That sentence changes behavior — it's why sudden 15% swings in reported CPA on a small iOS-heavy account are often modeling noise, not performance, and why the drop-diagnosis discipline starts with ground truth instead of dashboards.
Why small accounts get the foggiest data
Modeling is regression to priors, and priors need anchors. A large account with dense, deduplicated, CAPI-verified signal gives the models thousands of observed conversions to calibrate against — its 25% modeled layer is interpolation between solid points. A new account with 40 purchases a month, thin pixel history and no server events gives the models almost nothing — its modeled layer is closer to educated guessing, and it shows up as the volatility small advertisers know too well: CPAs that swing 30% week to week while nothing real changes. The uncomfortable structural truth: signal quality compounds with scale and account maturity, which is one more quiet reason warmed, history-rich account infrastructure outperforms fresh containers on identical campaigns — the models simply know it better.
Worked example: two accounts, same campaign, different fog
The compounding argument, made concrete. Account A: three years old, $80k/month, CAPI with email+phone at checkout and signup, dedup rate 97%, desktop-heavy B2B mix — call it 500 observed purchases anchoring every weekly read. Its modeled layer sits near the bottom of the band (~20%), and weekly CPA reads move ±5%: decisions land on solid ground. Account B: five weeks old, $6k/month, pixel-only, 65% iOS traffic, 38 purchases last month. Its modeled layer pushes past a third, and weekly CPA lurches ±25% — the operator has already rebuilt two campaigns chasing swings that never existed in Shopify. Same platform, same modeling systems; the difference is anchor density. The practical reading for Account B isn't despair — it's sequencing: CAPI with match keys first (the single biggest fog-cutter), judgments on two-week windows instead of daily reads, money math on store orders only, and patience while observed volume accumulates. Fog lifts with every anchor you add; panic just adds noise to it. Six months later, Account B's trajectory is the proof most operators need: CAPI shipped in week six, purchase volume past 150/month by month four, weekly CPA variance down to ±9% — the same modeling systems, now with something to hold onto.
The trust protocol
What to do with data that's 70% observation and 30% inference: (1) Let modeled numbers do their real job — steering delivery optimization, where directionally-right-at-volume beats precisely-wrong-and-slow. (2) Never let them near money decisions alone — budgets, hiring, inventory bets run on store revenue and MER, the numbers with zero inference in them. (3) Weight platform data by its observability — a CPA read on 300 weekly conversions with clean CAPI deserves more trust than the same read on 30 iOS-heavy pixel-only conversions; volume and signal density ARE the error bars. (4) Feed the models — every match key you add, every event you dedupe, every month of history you accumulate shrinks the inference layer and steadies your own reporting. Fog is partly a choice — and unlike most of this era's measurement problems, it responds to work you can ship this week.
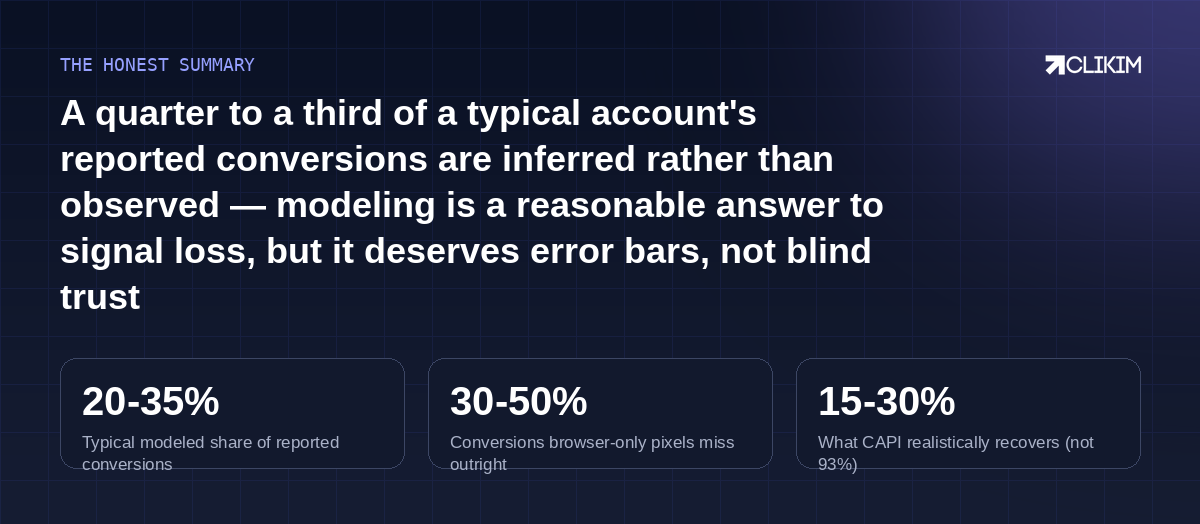
Observed for money, modeled for aim — and every signal improvement you ship converts guesses back into facts.
Frequently asked questions
What are modeled conversions on Meta?+
Is Meta making up my conversion numbers?+
How can I see what percentage of my conversions are modeled?+
How many users actually opt out of tracking on iOS?+
How much do ad blockers cost me?+
What's a realistic CAPI recovery rate?+
Do EU consent banners really block that much?+
Why does my small account's CPA swing wildly week to week?+
Does more spend actually improve data quality?+
Should I turn modeling off?+
How do the 2026 attribution changes interact with modeling?+
What single upgrade most shrinks my inference layer?+
Is TikTok's data more or less modeled than Meta's?+
What do I tell a client who asks if the numbers are real?+
Do delayed iOS conversions ever show up, or are they gone?+
Does Advantage+ / AI campaign automation change the modeling picture?+
Is there any way to audit Meta's modeling from outside?+
The models trust mature accounts more
Whitelisted infrastructure — history-rich, signal-dense containers where the inference layer has something to stand on.