
The 5 Facebook Ad Metrics That Actually Matter
Two diagnose creative, one diagnoses audience, one prices the campaign, one audits the business. Everything else in Ads Manager is an input or decoration.

The five: (1) CPA/cost per result — judged against YOUR breakeven (1 ÷ contribution margin), weekly; (2) hook rate (3-sec views ÷ impressions) — earliest creative signal, judge at 1,000 impressions vs account average; (3) link CTR — does interest survive (~1%+ prospecting); (4) frequency — fatigue alarm past ~2.5 prospecting; (5) MER (total revenue ÷ total spend) — monthly truth audit that catches attribution inflation. Deliberately ignore: impressions, reach, engagement counts on conversion campaigns, CPC in isolation, and platform ROAS without a MER check.
Five metrics, one decision chain
Ads Manager will happily drown you in 400+ columns, and most "what metrics should I track" content responds by listing twenty. Here's the honest version: five numbers carry every decision a media buyer actually makes, and they form a chain — two diagnose creative, one diagnoses audience, one prices the campaign, one audits the business. Everything else (CPM, CPC, reach, impressions…) is an input to these five or reporting decoration.
The chain: hook rate and CTR diagnose creative, frequency diagnoses audience, CPA prices the campaign, MER audits the business.
How to actually use the chain
Daily, per ad: hook rate and CTR. They stabilize on hundreds of impressions (not conversions), which makes them your earliest honest signals — a video under ~75% of your account's average hook rate is dead regardless of what CPA says later, and killing it at 1,000 impressions costs $10 instead of $100. Weekly, per ad set: CPA against YOUR breakeven — computed from margin (1 ÷ contribution margin), never from someone else's "good ROAS" (context in the benchmarks). Weekly, per audience: frequency — past ~2.5 on prospecting, rising CPMs and falling CTR are fatigue arriving on schedule; refresh creative or widen the pool. Monthly, per business: MER — total revenue ÷ total ad spend from the bank statement. Platform ROAS drifts optimistic as attribution flatters; MER can't. Steady dashboard + falling MER = you're being flattered, not enriched.
Metrics to deliberately ignore
Impressions and reach (inputs, not outcomes), engagement counts on conversion campaigns (applause isn't revenue — the boost-button lesson), CPC in isolation (cheap clicks from wrong people are expensive), relevance-type diagnostics as KPIs (useful tiebreakers, terrible north stars), and platform ROAS as gospel (audit with MER monthly). The discipline isn't knowing more numbers — it's refusing to let secondary numbers overrule the five that pay rent.
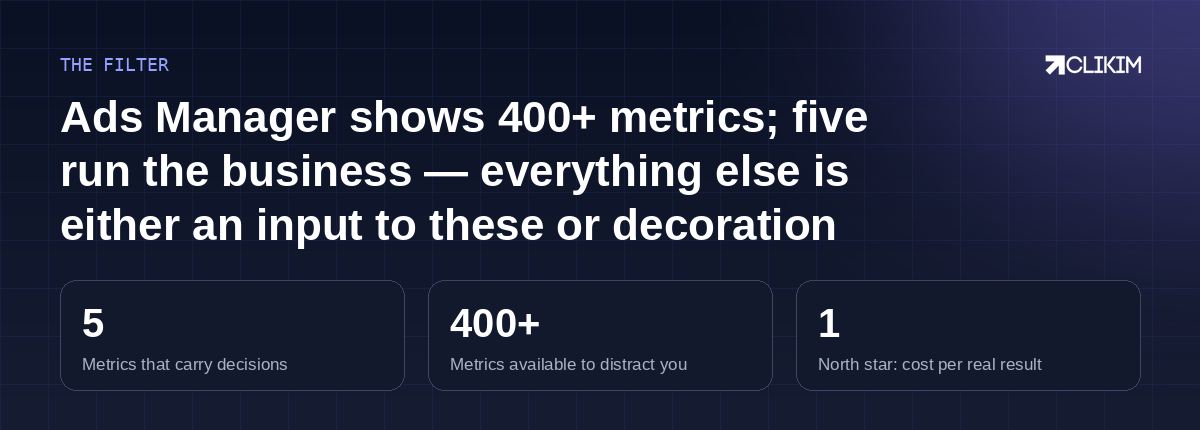
Two for creative, one for audience, one for price, one for truth — the rest is decoration.
Frequently asked questions
What's the single most important Facebook ads metric?+
What is hook rate and where do I find it?+
What's a good CTR for Facebook ads in 2026?+
At what frequency should I refresh creative?+
Why do I need MER if I already track ROAS?+
Should I watch CPM at all?+
Numbers green, ceiling low?
Uncapped, whitelisted infrastructure — scale what your five metrics already approved.