
Facebook Ads Benchmarks by Industry (2026)
CPM, CPC, CTR and conversion-rate ranges across 13 verticals — plus the part benchmark posts skip: how to diagnose which lever is broken when a number is out of range, and why your own trailing 30 days beats every table ever published.
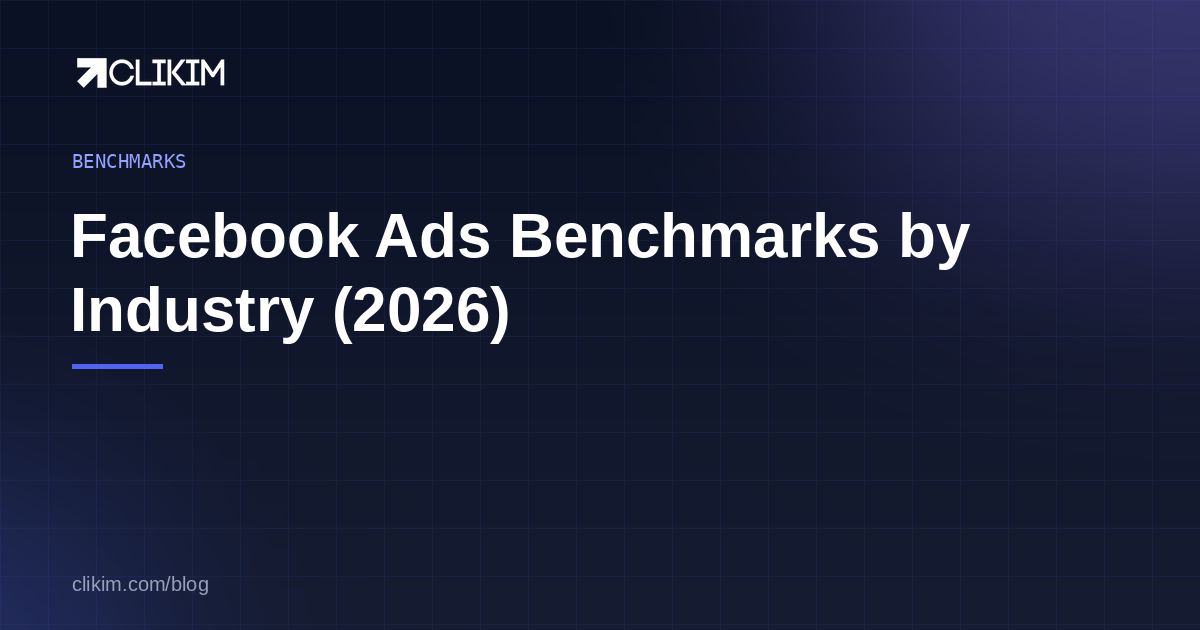
2026 all-industry medians: CPM ~$12–14, CPC ~$0.90–1.10, CTR ~1.4–1.6%. Consumer ecommerce runs $8–15 CPMs; regulated and high-value verticals (insurance, finance, legal, B2B) run $18–35+ with $2.50–6 CPCs — justified by customer value. Conversion rate tracks funnel friction more than industry: simple lead forms convert 8–15%, considered purchases 1.5–3.5%. Use tables to diagnose the out-of-range lever (CPM→creative/auction, CTR→hook, CVR→landing page), then benchmark against your own trailing 30 days.
• All-industry medians in 2026: CPM ~$12–14, CPC ~$0.90–1.10, CTR ~1.4–1.6% — but vertical ranges vary 3–4×. • Consumer ecommerce runs $8–15 CPMs; regulated/high-value verticals (finance, legal, B2B) run $18–35+. • Expensive clicks aren't bad economics: CPA vs customer value is the only verdict. • CVR tracks funnel friction more than industry — simple forms convert 5× considered purchases. • Benchmarks diagnose which lever is weak: high CPM → creative/auction; low CTR → hook; low CVR → landing page. • The benchmark that matters most is your own trailing 30 days. • Q4 inflates everything 30–60% — compare seasonally, not month-to-month.
The 2026 baseline numbers
Across all industries and objectives, Facebook advertising in 2026 clusters around these medians: CPM $12–14, CPC $0.90–1.10, CTR 1.4–1.6%, with conversion rates most commonly landing between 2% and 9% depending on what "conversion" means for the funnel. Those are anchor points, not targets — the whole story of benchmarks is how far individual verticals, audiences and offers swing around them.
A warning before the tables: benchmark data is directional by nature. Public reports aggregate wildly different advertisers, objectives and attribution setups, and the ranges below are compiled medians from such sources, not Meta-published truth. Use them the way a doctor uses population charts — to spot when something is far off — and then trust your own account's history over any table, including this one.
Consumer verticals, 2026 ranges. Illustrative medians compiled from public industry reports — validate against your own account.
High-value and regulated verticals
The second table is where sticker shock lives. Insurance, finance, legal and B2B routinely pay two to three times consumer-ecommerce rates for the same thousand impressions — because the auction prices the value of the audience, and everyone bidding on "people researching mortgages" knows what a funded loan is worth. High CPMs in these verticals aren't a problem to fix; they're the market being efficient.
High-value / regulated verticals pay more per impression and click — but a $6 click on a $5,000 client is a bargain.
The reframe that matters: a $5 click that converts at 4% into a $3,000 customer is spectacular economics, while a $0.40 click that converts at 1% into a $25 product is marginal. Cost-per-anything only means something next to value-per-customer — the arithmetic we walk through in what's a good ROAS and how much Facebook ads cost.
CTR: what "good" looks like
Click-through rate is the benchmark people quote most and understand least. The 2026 all-industry median for link CTR sits around 1.4–1.6%; consumer products with strong creative regularly run above 2%, while B2B and high-consideration offers live healthily under 1%. CTR is best read as a creative relevance signal: it tells you whether the hook and promise stop the right people, nothing more.
Chasing CTR for its own sake breeds clickbait that converts nowhere. The useful discipline: compare CTR within your account across creatives — your 2.1% ad beating your 1.2% ad is signal; your 1.2% ad "losing" to another industry's average is noise. Full treatment in what's a good CTR.
CPC: a ratio wearing a trench coat
Cost per click isn't really its own lever — it's arithmetic: CPC = CPM ÷ (CTR × 10). A $12 CPM at 1.5% CTR yields an $0.80 CPC; double the CTR and the same impressions produce $0.40 clicks. That's why obsessing over CPC directly is usually wasted motion — you lower it by either paying less for attention (CPM levers) or converting more attention into clicks (CTR levers), and the formula tells you instantly which side is dragging.
It also explains the high-value verticals' numbers: their CPCs look brutal mostly because CPMs are high and CTRs are naturally lower on considered offers. Same arithmetic, different inputs — not a sign anyone is doing anything wrong.
Conversion rate: funnel beats vertical
Conversion rates track funnel friction more than industry — a simple form converts 5× a considered purchase at any CPM.
Notice what drives these rows: not industry, but friction. A prefilled lead form converts at rates a $150 considered purchase will never see, in any vertical. So before comparing your CVR to a benchmark, compare your funnel to the funnel the benchmark assumes — most "our CVR is terrible" panics are really "we're comparing a two-step checkout to someone's newsletter signup".
When CVR genuinely lags your funnel type, the ad usually isn't the culprit — the click already proved interest. Look at page speed, message match between ad and page, trust signals and checkout friction. The diagnostic split is clean: CTR problems are ad problems; CVR problems are page and offer problems.
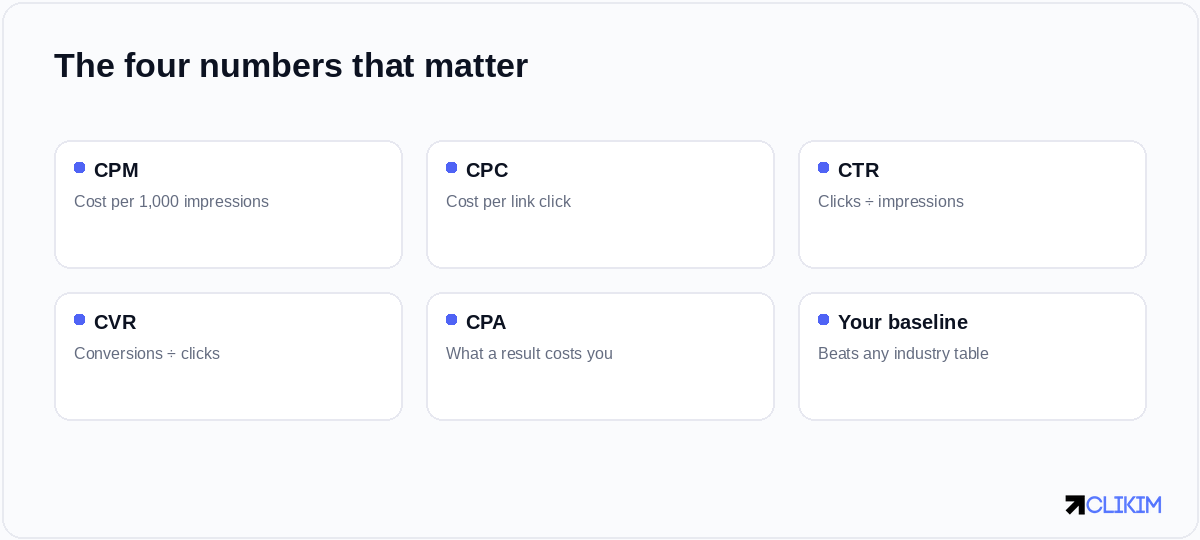
Four numbers, four different diagnoses — and your own baseline outranks every table.
Using benchmarks to diagnose (the actual point)
A benchmark table earns its keep when a metric is far outside range, because which metric is off points at which lever is broken. CPM double your vertical's range? Either your audience is tiny/contested, your creative is being penalised for weak engagement, or your account's trust standing is dragging delivery — see what's a good CPM. CTR far below range? The hook isn't stopping your buyer — creative surgery, per our creative playbook. CVR below your funnel type? The page, offer or checkout is leaking, not the ad.
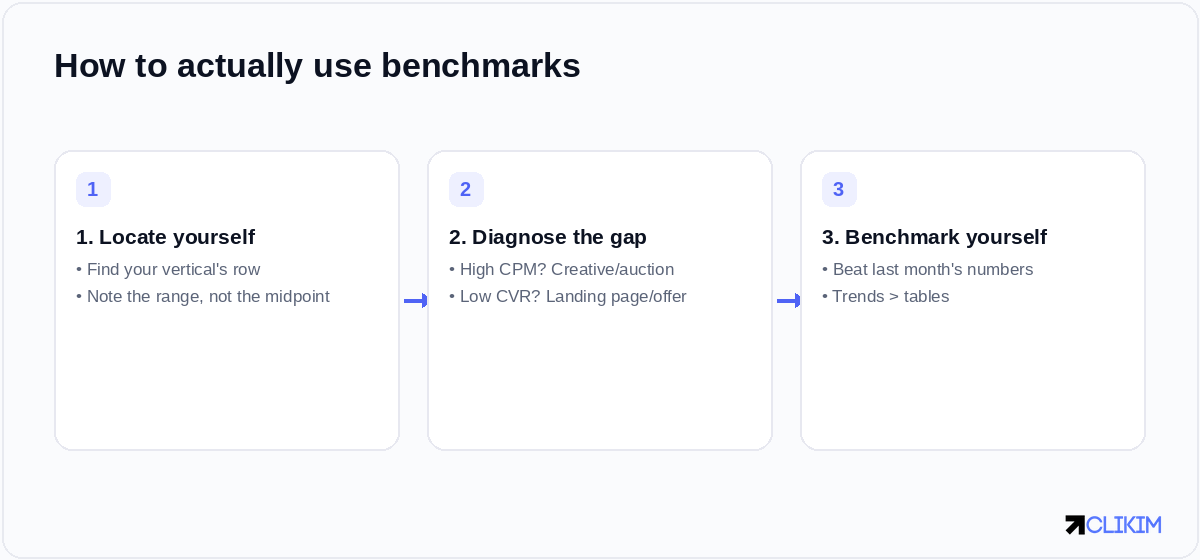
Locate yourself, diagnose the out-of-range metric, then switch to beating your own trailing baseline.
And CPA above target with everything else in range? That's not a metric problem — that's unit economics meeting the auction honestly. The fixes are structural: higher AOV, better LTV, tighter funnel, or accepting the volume/efficiency trade covered in cost cap bidding.
Objective and placement move the numbers too
Two more variables quietly reshape any benchmark comparison. Objective: awareness and reach campaigns buy the cheapest impressions (often $3–6 CPMs) because Meta only has to show the ad; conversion and purchase objectives pay premium CPMs ($15–30+ in the same vertical) because the system hunts rarer, higher-intent people. Comparing your purchase campaign's CPM to a competitor's reach campaign is comparing different products. Placement: Reels and Stories inventory generally runs cheaper than Feed, and Audience Network cheaper still — so an account leaning on automatic placements will show blended numbers that differ from a Feed-only account without either being "better".
The practical rule: when quoting or comparing any benchmark, pin down objective and placement mix first. Most apples-to-oranges panics dissolve at this step — and most "we beat the benchmark!" celebrations do too.
Build your own benchmark sheet (15 minutes)
Since your own baseline is the benchmark that matters, formalise it. Pull the last 90 days from Ads Manager, split by month, and record five numbers per month at the account level: CPM, CPC, link CTR, CVR, and blended CPA. Add two context columns — total spend and dominant objective — so future-you knows what the numbers meant. That's the whole sheet; it takes fifteen minutes and instantly outperforms every public table for decision-making.
Then review it weekly against the trailing 30 days. The questions that matter are trend questions: is CPM drifting up without a creative change (fatigue, seasonality, or trust)? Is CTR decaying on a winner (rotate creative)? Did CVR drop after a site change (fix the page)? This is exactly the weekly rhythm our optimization checklist builds into a routine — benchmarks as an early-warning system rather than a vanity scoreboard.
Seasonality: compare like-for-like
Every number above breathes with the calendar. Q4 — Black Friday through Christmas — inflates CPMs 30–60% across most verticals as retail floods the auction; January deflates them; and vertical-specific spikes (insurance in enrollment seasons, fitness in the new year, education in late summer) move individual rows hard. A "worsening" CPM in November is usually just November.
The rule: compare month-over-month only within seasons, and year-over-year across them. If you must judge a Q4 number, judge it against last Q4 — and budget the spike in advance, as covered in our ecommerce playbook.
The benchmark that actually matters: you
Here's the uncomfortable truth about industry tables: the variance within a vertical dwarfs the variance between verticals. Two apparel brands can sit at $7 and $19 CPMs simultaneously — different creative quality, audience breadth, account trust, offer strength. Industry averages average away everything that makes your account yours.
So graduate to self-benchmarking as fast as you can: trailing 30-day CPM, CPC, CTR, CVR and CPA, tracked weekly, judged on trend. "CPM up 20% with no creative change" is actionable intelligence; "CPM above the industry table" is trivia. External benchmarks locate you once — your own baseline steers you forever. That requires trustworthy data, which means pixel + Conversions API before you trust any CVR or CPA you measure.
One benchmark nobody publishes: account trust
Two identical advertisers with identical creative do not pay identical CPMs — because delivery quality tracks the account's standing. Low-trust accounts (new, previously flagged, or capped) get more conservative delivery, tighter review, and effectively worse auction outcomes; the $250/day new-account cap is just the visible edge of it. If your numbers trail every table despite solid creative, the account itself belongs on the suspect list — see Account Quality explained.
It's also why serious spenders run on whitelisted agency ad accounts: mature trust standing, no preset caps, and stable delivery — the invisible benchmark set to "pass" so the visible ones reflect your actual marketing.
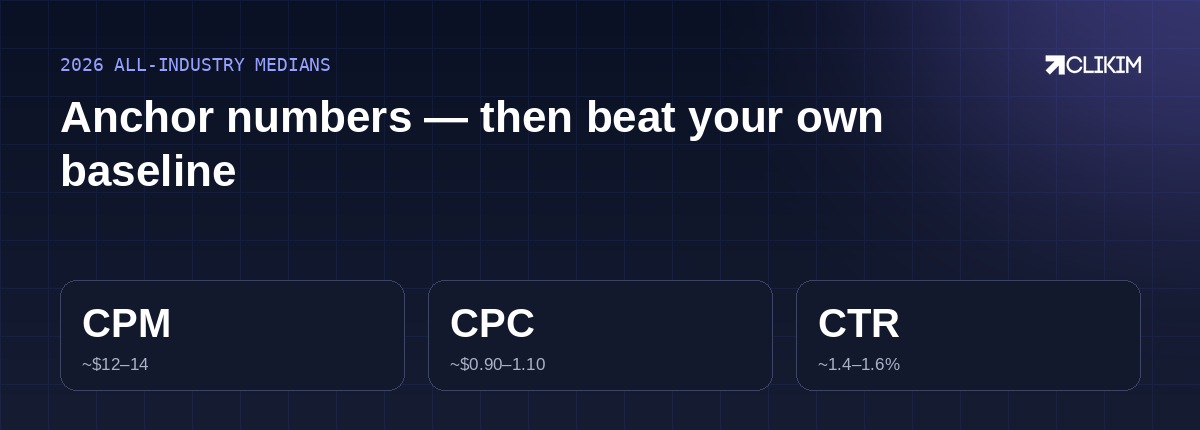
Anchor on the medians, diagnose the outliers — then beat your own trailing 30 days.
The 2026 cost benchmark meta-analysis — why WordStream, Triple Whale and Lebesgue all report different numbers.
Frequently asked questions
What is the average CPM for Facebook ads in 2026?+
What is the average CPC for Facebook ads?+
What is a good CTR for Facebook ads?+
What is a good conversion rate for Facebook traffic?+
Why is my CPM so much higher than the benchmark?+
Why are finance and legal CPCs so expensive?+
How much do benchmarks change in Q4?+
Should I optimize my ads to beat industry benchmarks?+
Which metric should I fix first if several look bad?+
Are these benchmark numbers exact?+
Does account quality really affect my benchmarks?+
What data do I need before trusting my own benchmarks?+
Stop benchmarking against a handicap
Run on managed whitelisted infrastructure with mature trust, no preset caps and stable delivery — so your numbers reflect your marketing, not your account's probation. Operated on BM2500 infrastructure.