
Google Ads Benchmarks 2026: What Clicks and Leads Really Cost
Most Google Ads ‘benchmarks’ floating around the internet are eight years old. This page carries the current numbers — every one with its source and data window attached — plus the trend that actually matters in 2026: clicks keep getting pricier, but conversion rates are climbing fast enough that leads just got cheaper for the first time in five years.
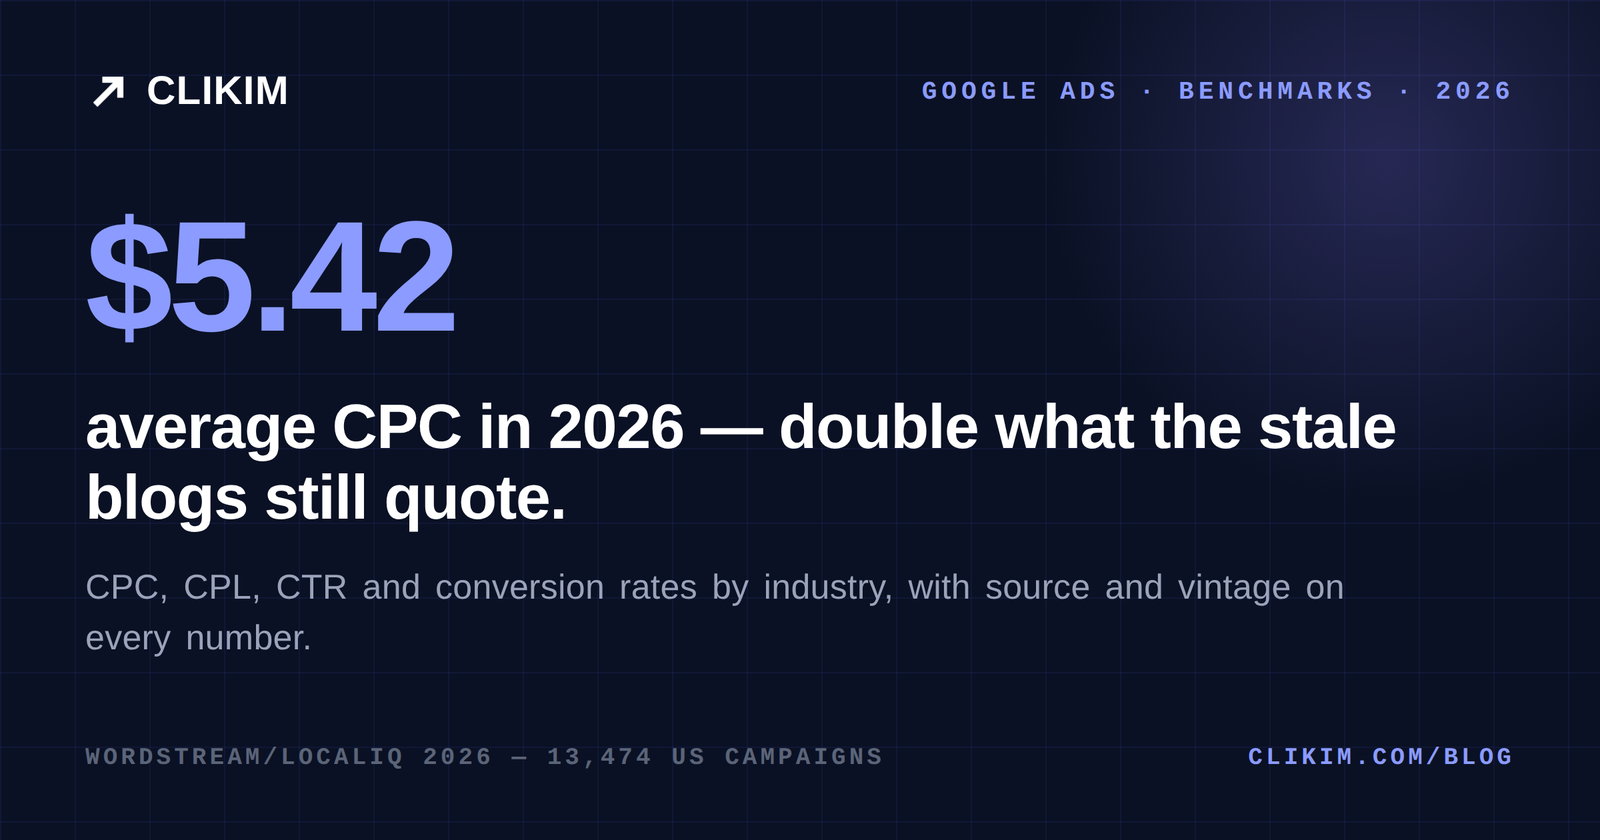
2026 US search averages: $5.42 CPC, $66.69 cost per lead, 8.18% conversion rate, 6.64% CTR (WordStream/LocaliQ, 13,474 campaigns, Apr 2025–Mar 2026).
The headline trend: CPC inflation slowed to ~3% after two brutal years — and because conversion rates improved in 87% of industries, average cost per lead fell for the first time in five years.
Cheapest clicks: arts & entertainment ($1.63). Priciest: legal ($9.87). Use the per-industry tables below, and ignore any article still quoting $2.69 CPCs — that number is from 2018.
How to read benchmarks without fooling yourself
One methodology note before the numbers, because it changes how you use them. The only current, annually-refreshed public benchmark series for search is WordStream/LocaliQ’s — the 2026 edition covers 13,474 US campaigns from April 2025 through March 2026. It’s US-only, weighted toward small and mid-sized advertisers, and blends a minority of Microsoft Ads traffic. That makes it excellent for orientation and useless as a promise.
Your account’s numbers are set by your industry, geography, offer and account trust — a new account pays a real premium until it earns standing (the mechanics are in our complete guide). Benchmarks tell you which postcode you’re in, not which house.
Average CPC by industry
The all-industry average is $5.42 per click in the 2026 dataset. The spread around it is enormous:
| Where clicks are cheap | CPC | Where clicks are expensive | CPC |
|---|---|---|---|
| Arts & Entertainment | $1.63 | Attorneys & Legal | $9.87 |
| Restaurants & Food | $2.05 | Home & Home Improvement | $8.33 |
| Travel | $2.14 | Dentists & Dental | $8.00 |
WordStream/LocaliQ 2026 (US, SMB-weighted). The 6x spread is the point: industry decides your price class before you write an ad.
The logic behind the spread is customer value: a signed legal client is worth thousands, so attorneys rationally bid $10 clicks. If your unit economics can’t survive your industry’s click prices, the fix is a better funnel or a different query set — not a cleverer bid.
The CPC inflation curve, 2023–2026
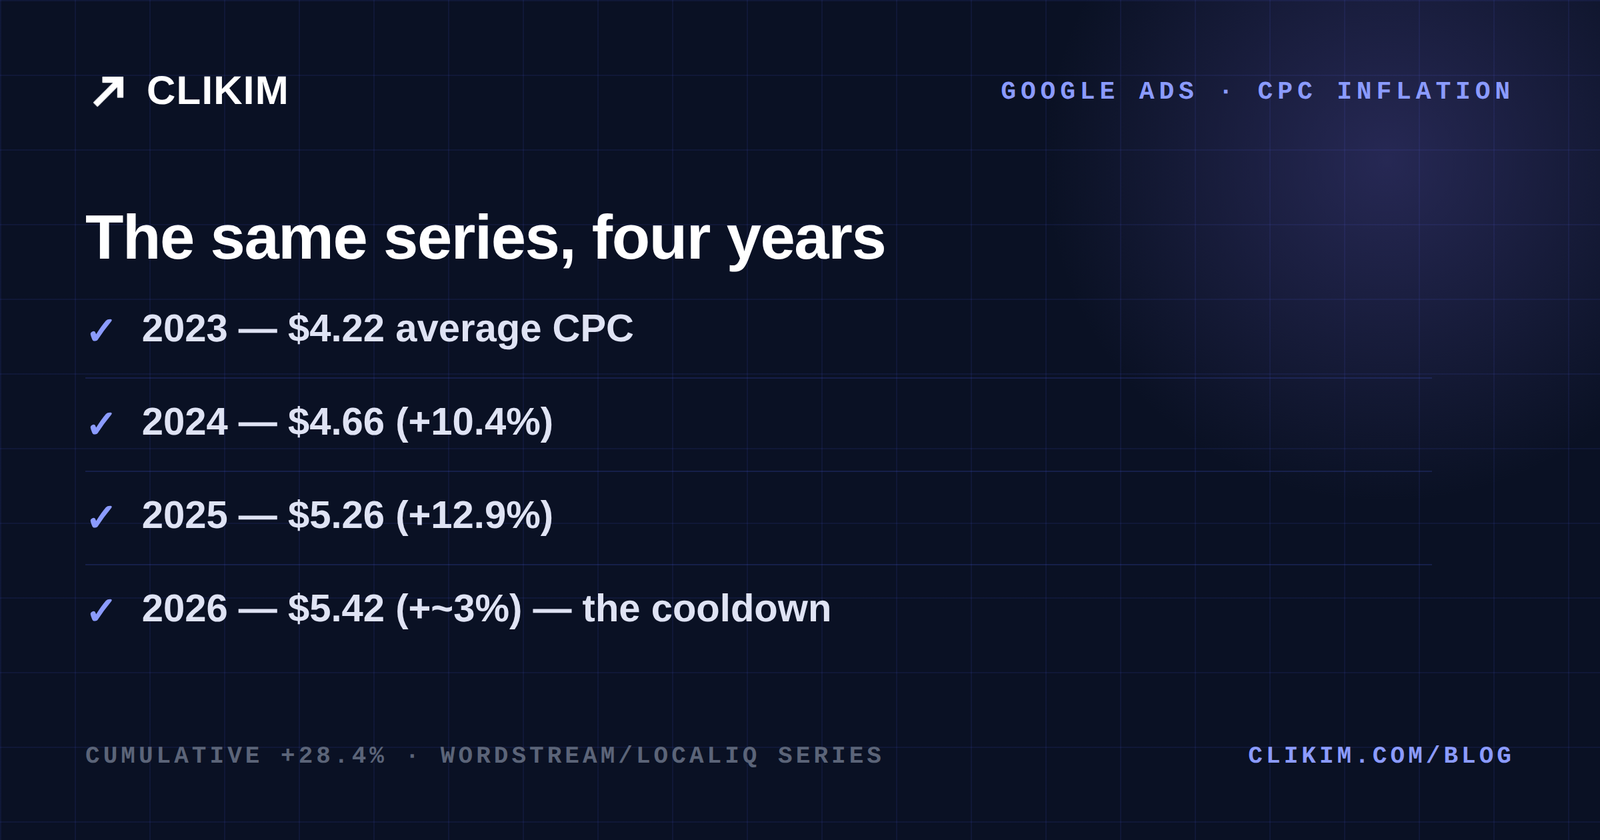
Same source series, four years: +28.4% cumulative — but 2026’s ~3% rise is the slowest of the run.
Tracked through the same source series, the average CPC went $4.22 (2023) → $4.66 (+10.4%) → $5.26 (+12.9%) → $5.42 (+~3%) — a cumulative +28.4% in three years, and more than double the $2.32 of a decade ago. The 2026 deceleration is the notable part: after two years of double-digit inflation, click prices nearly flattened.
Plan on paying more per click every year — and on the compounding math being survivable only if your conversion rate improves alongside. Which, per the next section, is exactly what’s happening for disciplined accounts.
Cost per lead and conversion rates
The 2026 story most coverage missed: average cost per lead fell to $66.69 — the first overall decline in five years (from $70.11 in the 2025 report). It fell while clicks got more expensive, because the average conversion rate jumped to 8.18% and improved in 87% of industries.
| Metric | 2023 | 2025 | 2026 |
|---|---|---|---|
| Average CPC | $4.22 | $5.26 | $5.42 |
| Average CPL | — | $70.11 | $66.69 |
| Average CVR | 7.04% | 7.52% | 8.18% |
Same-series trend. Smart Bidding maturity, better landing pages and AI-assisted matching are pushing conversion — enough to outrun click inflation.
Per-industry CPL anchors: automotive repair leads run around $28.50, restaurants and entertainment near $30, pets around $32 — while legal routinely clears $130+ per lead and still profits, for the same customer-value reason it pays $10 clicks. Conversion-rate stars: animals & pets at 16.22% and auto repair at 15.51% — urgency converts.
CTR benchmarks
Average search CTR held at 6.64% (statistically flat YoY). Arts & entertainment leads at 12.75%; finance and travel both clear 9%; legal sits at the bottom around 5.9% — expensive AND hard to earn the click, a fun combination. The big movers were education (+31.7% YoY), beauty and finance (both +18%) — a hint that AI-assisted ad copy is lifting engagement where advertisers actually adopted it.
Use CTR diagnostically, not as a goal: a CTR far below your industry’s number means message-market mismatch; a sky-high CTR with no conversions means you’re writing great ads for the wrong promise. What “good” looks like for your vertical is in the tables; what profitable looks like is in your P&L.
Shopping, YouTube, Display and PMax
- Shopping: European retail data (smec Market Observer) shows median Shopping CPC rising from ~€0.28 to ~€0.36 across the year to April 2026 — steep inflation that only recently cooled. US Shopping lacks an equivalent public series; expect the same direction.
- YouTube: credible sources disagree by 3x, so treat CPM as a range: roughly $3–12 depending on format, market and advertiser size. The strongest single study (Adzoola, $14.3B of tracked spend) puts the average near $9.29, with non-skippable formats above $11. Skippable CPVs cluster around $0.02–0.05 — anyone quoting $0.10–0.30 is reciting 2019.
- Display: no authoritative benchmark exists; aggregates land near $3 CPM with a spread from under $1 (general-interest) to $18+ (financial). Placement hygiene moves your number more than bidding does.
- Performance Max: honestly — no independent, current, large-sample PMax benchmark exists. Channel-level reporting only became broadly available mid-2025, so older “PMax ROAS” studies measured a black box. Google’s own claim is ~27% more conversions at similar CPA; treat it as the vendor’s number and benchmark PMax against your own Search + Shopping baseline instead.
The AI Overviews wildcard
The most consequential 2026 variable isn’t in the auction — it’s above it. Seer Interactive’s tracking of informational queries found that when an AI Overview is present, paid CTR drops by roughly two-thirds (19.7% → 6.3%) — while brands cited inside the AI Overview earned +91% more paid clicks. Google’s own position (Q3 2025 earnings) is that AI Overviews “monetize at approximately the same rate” as classic search.
Both can be true: the click pool on informational queries is shrinking and re-concentrating on cited brands, while commercial queries — where you spend — are so far less disrupted. The operational takeaway: watch your impression-to-click curves on top-funnel queries, and treat being citable (by AI engines and Google alike) as part of your paid strategy, not just your SEO team’s problem.
The stale numbers to stop citing
Half the “Google Ads benchmarks” content ranking today recycles figures from a 2018 dataset. A field guide to the zombies, so you can spot an outdated article in one glance:
- “Average CPC is $2.69.” That’s 2018. The same source series says $5.42 today — the old number is off by exactly 2x.
- “Average CTR is 3.17%.” Also 2018. Current: 6.64%.
- “Average conversion rate is 3.75%.” Same vintage. Current: 8.18%.
- “Businesses make $8 for every $1 spent on Google Ads.” Google’s own economic-impact multiplier, built on 2009-era assumptions — a policy talking point, not a performance benchmark.
- “PMax averages 600%+ ROAS.” From PMax’s 2021–22 launch window, measured on a black box that no longer exists.
- “Broad match drives 35% more conversions.” Google’s claim, published without cost-per-conversion context — quote it as the vendor’s number or not at all.
The tell in every case is a missing data window. A benchmark without a vintage isn’t a benchmark; it’s an antique.
Turning benchmarks into budgets
The honest four-step use of everything above: (1) take your industry’s CPC and CVR, (2) compute an expected CPL — CPC ÷ CVR gets you close, (3) multiply by the leads your sales math needs for a monthly budget with a real confidence interval, (4) compare your account’s actuals against the benchmark quarterly — beating it means scale harder, trailing it badly means fix the funnel before feeding it.
And a structural note from the trenches: benchmark numbers assume an account allowed to compete. New accounts carry trust ramps and payment-threshold friction that quietly tax every metric on this page; established structures don’t. That difference — and how managed Google Ads infrastructure removes it — is the boring advantage under most “how are their CPCs so low?” stories.
Frequently asked questions
What is the average Google Ads CPC in 2026?+
What is a good cost per lead on Google Ads?+
What is a good Google Ads conversion rate?+
Are Google Ads getting more expensive?+
What’s a normal YouTube ads CPM?+
Are AI Overviews making Google Ads worse?+
Why are my CPCs higher than these benchmarks?+
Benchmarks assume an account that’s allowed to compete
Managed Google Ads infrastructure through Clikim — established structures, invoiced billing and real support, so your numbers reflect your marketing instead of your account’s age.