
What Is a Good ROAS on Facebook? (And How to Improve It)
Everyone wants a single 'good ROAS' number, but the honest answer depends on your margins. Here's how to find your real target with break-even ROAS, first-purchase vs lifetime value, ROAS by funnel stage, why platform ROAS lies, and how to improve it.
ROAS is revenue ÷ ad spend — a 3x ROAS means $3 back per $1. There's no universal 'good' ROAS: it's good if it clears your break-even ROAS (roughly 1 ÷ profit margin). Thin-margin businesses need a higher ROAS than high-margin ones. Track blended ROAS (total revenue ÷ total spend), judge funnel stages separately, and remember that maximising ROAS often means under-spending — so chase total profit, not the ratio.
• ROAS = revenue ÷ ad spend. A 3x ROAS means $3 back for every $1 spent. • There's no universal 'good' ROAS — it's good if it clears your break-even (1 ÷ margin). • Thin-margin businesses need a higher ROAS to profit than high-margin ones. • Platform ROAS overstates reality; track blended ROAS (total revenue ÷ total spend) too. • Retargeting ROAS looks high but can't scale; cold ROAS is lower but is what grows you. • Improve ROAS by lifting conversion value and cutting cost per result — and by fixing tracking. • Sometimes a lower ROAS at higher volume makes more total profit — chase profit, not a vanity ratio.
What ROAS is
ROAS — return on ad spend — is the simplest, most important number in performance advertising: revenue divided by ad spend. A 3x ROAS means you earned $3 in revenue for every $1 you put into ads. It's the scoreboard that tells you whether your advertising is making money, and it's the metric every other metric ultimately rolls up into. CPM, CPC and CPA all matter, but ROAS is the one your bank account cares about.
The catch — and the reason this guide exists — is that "what's a good ROAS" has no universal answer. A 2x ROAS can be brilliant for one business and bankrupting for another, depending entirely on margins. So before we talk numbers, we have to talk about the one calculation that turns ROAS from a vanity metric into a decision tool: your break-even.
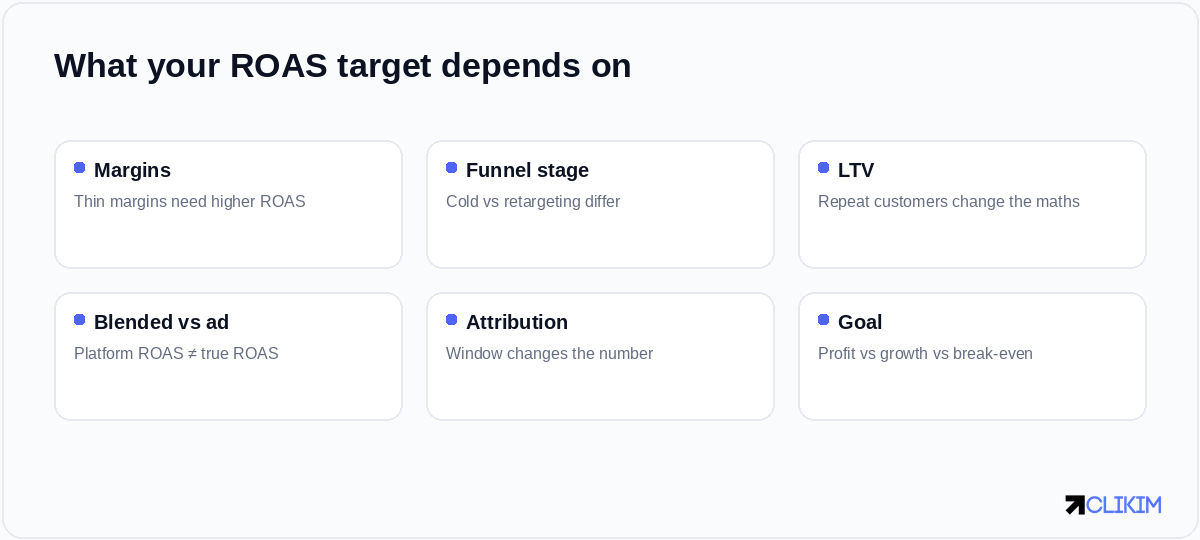
Your ROAS target isn't a benchmark you copy — it's a number you derive from your own margins and goals.
What counts as a good ROAS?
People want a single figure, so here's the honest version: many ecommerce stores treat 2–4x as the workable zone, with 4x+ considered strong and under 2x often unprofitable once you subtract real costs. But those numbers are close to meaningless without your margins attached.
There's no universal 'good' ROAS — it's good if it clears your break-even after product, shipping and overhead.
Use the table as a rough orientation, not a target. The only ROAS that's truly "good" is one that clears your break-even after all costs — which is why the next section matters more than this one. Copying someone else's ROAS target is like copying their medication: it might be exactly wrong for you.
The number that actually matters: break-even ROAS
Your break-even ROAS is roughly 1 ÷ your profit margin. If your margin after product cost, shipping and fees is 33%, your break-even ROAS is about 3x — below that you're losing money on ads, above it you're profiting. If your margin is 50%, break-even is 2x. If it's 20%, you need 5x just to break even.
Break-even ROAS ≈ 1 ÷ margin. Thin margins demand a higher ROAS just to break even — know yours before judging a campaign.
This single calculation reframes everything: a "low" 2x ROAS is profitable for a high-margin business and fatal for a thin-margin one. Always know your break-even before you judge a campaign — it converts ROAS from a number you anxiously stare at into a clear line that tells you whether to scale, hold, or cut.
What your ROAS target depends on
- Margins. The biggest factor — thin margins demand a higher ROAS to profit.
- Customer lifetime value. If buyers repeat, you can accept a lower first-purchase ROAS and still win over time.
- Funnel stage. Retargeting ROAS looks high but is limited in volume; cold-prospecting ROAS is lower but scalable.
- Goal. Pure profit, aggressive growth, or break-even-to-acquire-customers are different strategies with different ROAS targets.
First-purchase ROAS vs lifetime value
One of the most important — and most ignored — nuances is the difference between the ROAS on a customer's first order and what that customer is worth over time. If your average buyer comes back and purchases again, a first-purchase ROAS that merely breaks even can still be enormously profitable once repeat orders are counted. Businesses with strong retention can afford to "lose" on acquisition because they win on lifetime value.
This is why sophisticated advertisers set their ROAS targets against customer lifetime value, not just the first sale. If you only judge campaigns on immediate ROAS, you'll systematically under-invest in acquiring customers who'd be highly profitable over a year — and hand that growth to a competitor who does the LTV maths.
ROAS by funnel stage
Not all ROAS is created equal, and comparing across funnel stages is a classic error.
Each funnel stage has a different natural ROAS — judge them by their job, not against each other.
Retargeting shows a flattering ROAS because it harvests demand you already created — but it can't scale, because the warm audience is finite. Cold prospecting shows a lower ROAS but is the engine of growth, because it's where new customers come from. Judge each stage by its role, and never let retargeting's high ROAS trick you into starving the prospecting that feeds it.
Platform ROAS vs blended ROAS
Here's a trap that fools a lot of advertisers: the ROAS Meta reports is usually higher than your true return, because of attribution (Meta claims credit for sales it influenced) and because retargeting recycles existing demand. The fix is blended ROAS — your total revenue divided by your total ad spend across everything.
Platform ROAS is useful for comparing ads to each other; blended ROAS tells you whether the business is actually making money. Watch both, and trust blended for the big decisions. Cleaning up tracking with the Conversions API also tightens the gap between reported and real, so your platform ROAS becomes more trustworthy over time.
How attribution windows change the number
ROAS isn't even a fixed figure for the same campaign — it shifts with your attribution window. A longer window (say, 7-day click) credits more conversions to your ads, raising reported ROAS; a shorter window (1-day click) lowers it. Neither is "right"; they're different lenses. The mistake is comparing a campaign on one window to a benchmark on another and drawing conclusions. Pick a consistent window and compare like-for-like.
How to improve your ROAS
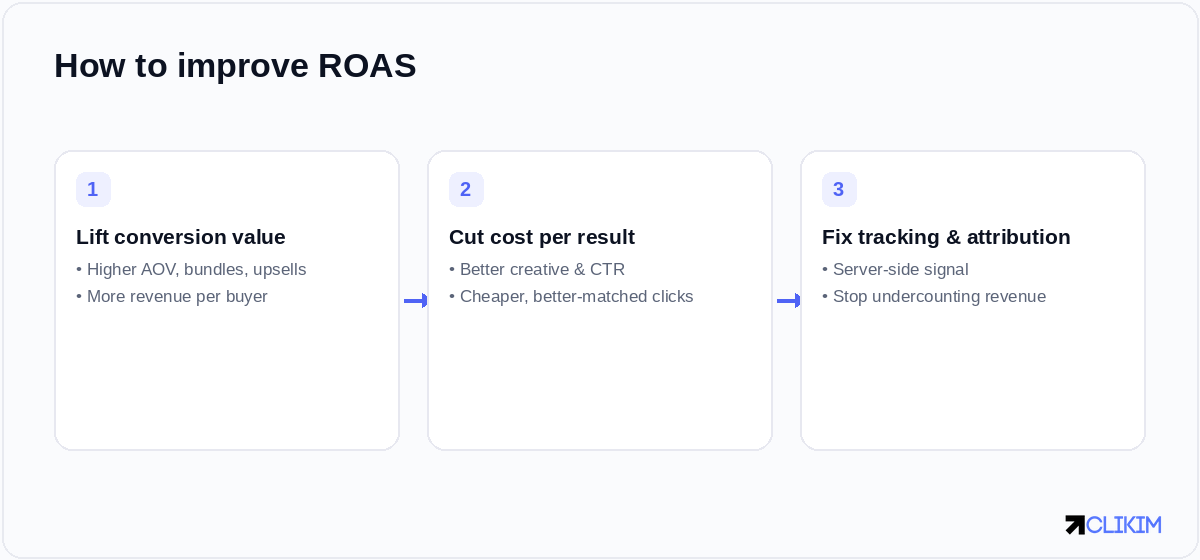
Two levers move ROAS: more revenue per buyer, and lower cost per result — plus honest tracking.
ROAS has only two real levers — make more per customer, or spend less per customer — plus a hygiene factor (don't undercount revenue).
- Lift conversion value. Raise average order value with bundles, upsells and higher-value offers; improve conversion rate with a better funnel. More revenue per buyer lifts ROAS directly.
- Cut cost per result. Stronger creative and a higher CTR lower your CPM and cost per acquisition, so each sale costs less to win.
- Fix tracking and attribution. If your pixel undercounts purchases, your ROAS looks worse than reality and you may cut winners — server-side tracking recovers that revenue in the data.
When a lower ROAS is the right call
The most counter-intuitive truth about ROAS: maximising it is often the wrong goal. A 10x ROAS usually means you're under-spending — staying in a tiny, warm audience and leaving money on the table. Pushing into colder, larger audiences will lower your ROAS but can dramatically increase total profit, because you're doing far more volume above break-even.
Past a point, chasing a high ratio caps your growth. The right target is the ROAS that maximises total profit, not the highest number you can show in a screenshot. A business doing 2.5x ROAS on $100k/month is making far more money than one doing 6x on $10k — and the first one is the one that's actually growing.
ROAS vs MER: the metric founders actually live on
As a business grows, platform ROAS becomes less useful as a north star and a related metric takes over: MER, or marketing efficiency ratio — total revenue divided by total marketing spend across every channel. Where ROAS asks "how did this campaign do," MER asks "did the whole machine make money this month." It's immune to attribution games, because it doesn't care which channel claims a sale; it only looks at money in versus money out. Founders and finance teams tend to steer by MER precisely because it can't be inflated by a platform crediting itself.
The practical move is to watch both at different altitudes: use per-campaign ROAS to decide which ads to scale or cut day-to-day, and use MER to sanity-check that all that activity is actually growing the bottom line. It's entirely possible to have great-looking campaign ROAS and a flat MER — usually a sign that your ads are harvesting demand that would have converted anyway. When the two disagree, trust MER for the big calls.
Common ROAS mistakes to avoid
A few recurring errors quietly cost advertisers money. The first is judging a campaign on its first day or two, while it's still in the learning phase and its ROAS is unrepresentative. The second is comparing ROAS across different attribution windows or funnel stages as if they were the same number. The third — the most expensive — is treating ROAS as a target to maximise rather than a constraint to clear, which leads to chronic under-spending in small warm audiences.
The fourth is trusting platform-reported ROAS without ever checking it against blended numbers or actual bank deposits. Reported ROAS drifts from reality whenever tracking degrades, so a campaign can look like it's improving on-screen while the business makes less. Reconcile to real revenue regularly, and you'll catch the gap before it costs you a quarter of growth.
ROAS, scaling and the account
This is exactly why scaling matters: if you can stay profitably above break-even while spending more, you should — total profit, not ROAS, is the goal. But you can only do that if the account lets you. A $250/day cap forces you to keep a high ROAS by under-spending, leaving profit on the table you can literally see but can't reach.
Running on an account with no preset cap lets you trade a little ROAS for a lot more total profit — the move that actually grows a business. For the safe way to do it without losing the account under you, see scaling without getting banned.
the ROAS-drop diagnostic — when a 'bad' ROAS is a measurement artifact. how much Meta data is real — the deflators to apply before judging any benchmark. does Meta steal credit — lift tests and the honest answer.
Frequently asked questions
What is a good ROAS on Facebook?+
What is ROAS?+
How do I calculate break-even ROAS?+
Why is my Meta-reported ROAS higher than my real return?+
What is blended ROAS?+
Should I judge campaigns on first-purchase ROAS or LTV?+
Why does retargeting have a higher ROAS?+
How do I improve my ROAS?+
Is a higher ROAS always better?+
How does attribution window affect ROAS?+
What ROAS do I need to be profitable?+
Why can't I scale even though my ROAS is great?+
A great ROAS you can't scale is profit left on the table
Run on managed whitelisted infrastructure with no preset cap, so you can spend into profit instead of being forced to keep ROAS artificially high. Operated on BM2500 infrastructure.