
Facebook Ads Cost Benchmarks 2026: Every Dataset, One Honest Table
WordStream says clicks cost $0.70. Lebesgue says US CPMs top $20. Both are right — and that’s the problem with benchmark content. We synthesized every major published dataset into one methodology-transparent report: CPM, CPC, cost per lead and CTR by industry, the 2023–26 trend, the Q4 tax, and the five questions that tell you which numbers actually apply to you. Refreshed quarterly.
Expect about $0.70 a click on traffic campaigns and $1.92 on lead campaigns. Reach is pricier than it used to be — DTC brands see a median $13.48 CPM, while US advertisers really pay $21–24. A typical lead runs $27.66. Every number climbs 20–50% in Q4. The honest answer is a range, and this report maps all of it.
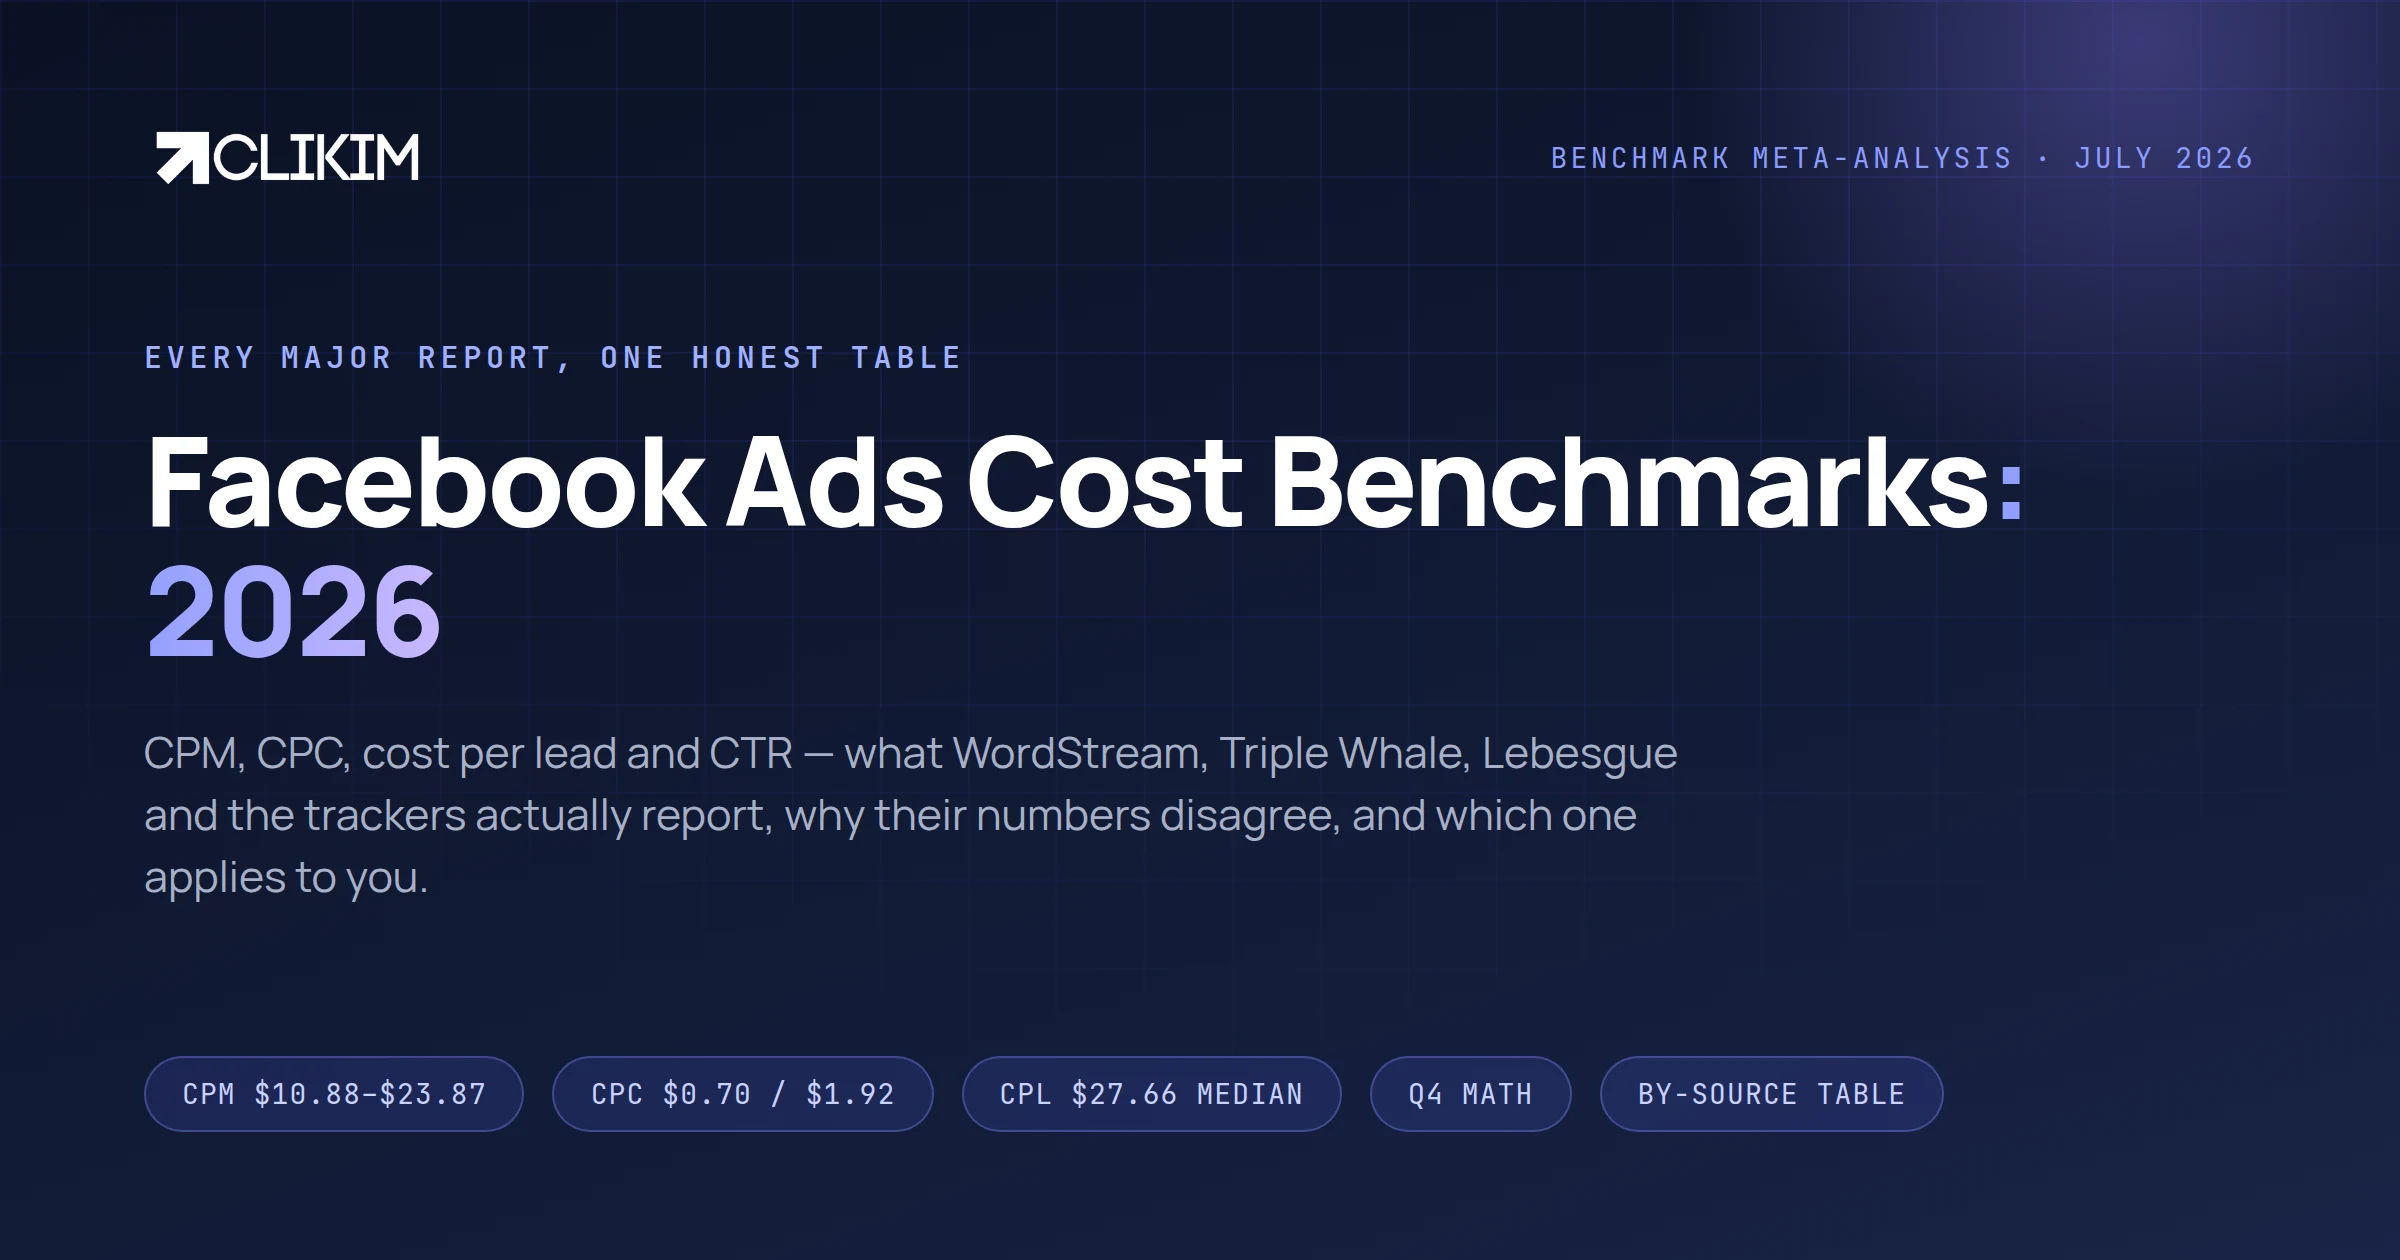
CPC $0.70 / $1.92 CPM $13.48–$23.87 CPL $27.66 MEDIAN Q4: +20–50% +20% CPM IN 2025
How much do Facebook ads cost in 2026?
Across the major published datasets, Facebook advertising in 2026 costs about $0.70 per click on traffic campaigns, $1.92 per click on lead campaigns, $13.48–$23.87 per thousand impressions depending on geography, and a median of $27.66 per lead in the US. Every one of those numbers hides a range — and the ranges are the useful part.
This report is a meta-analysis, not another survey. We took the numbers that WordStream, Triple Whale, Lebesgue, Gupta Media, Birch, Madgicx and AdAmigo actually published between 2024 and 2026, put them in one place, and — more importantly — explain why they disagree with each other. Because they do, loudly, and pretending otherwise is how advertisers end up benchmarking against a number that was never about them.
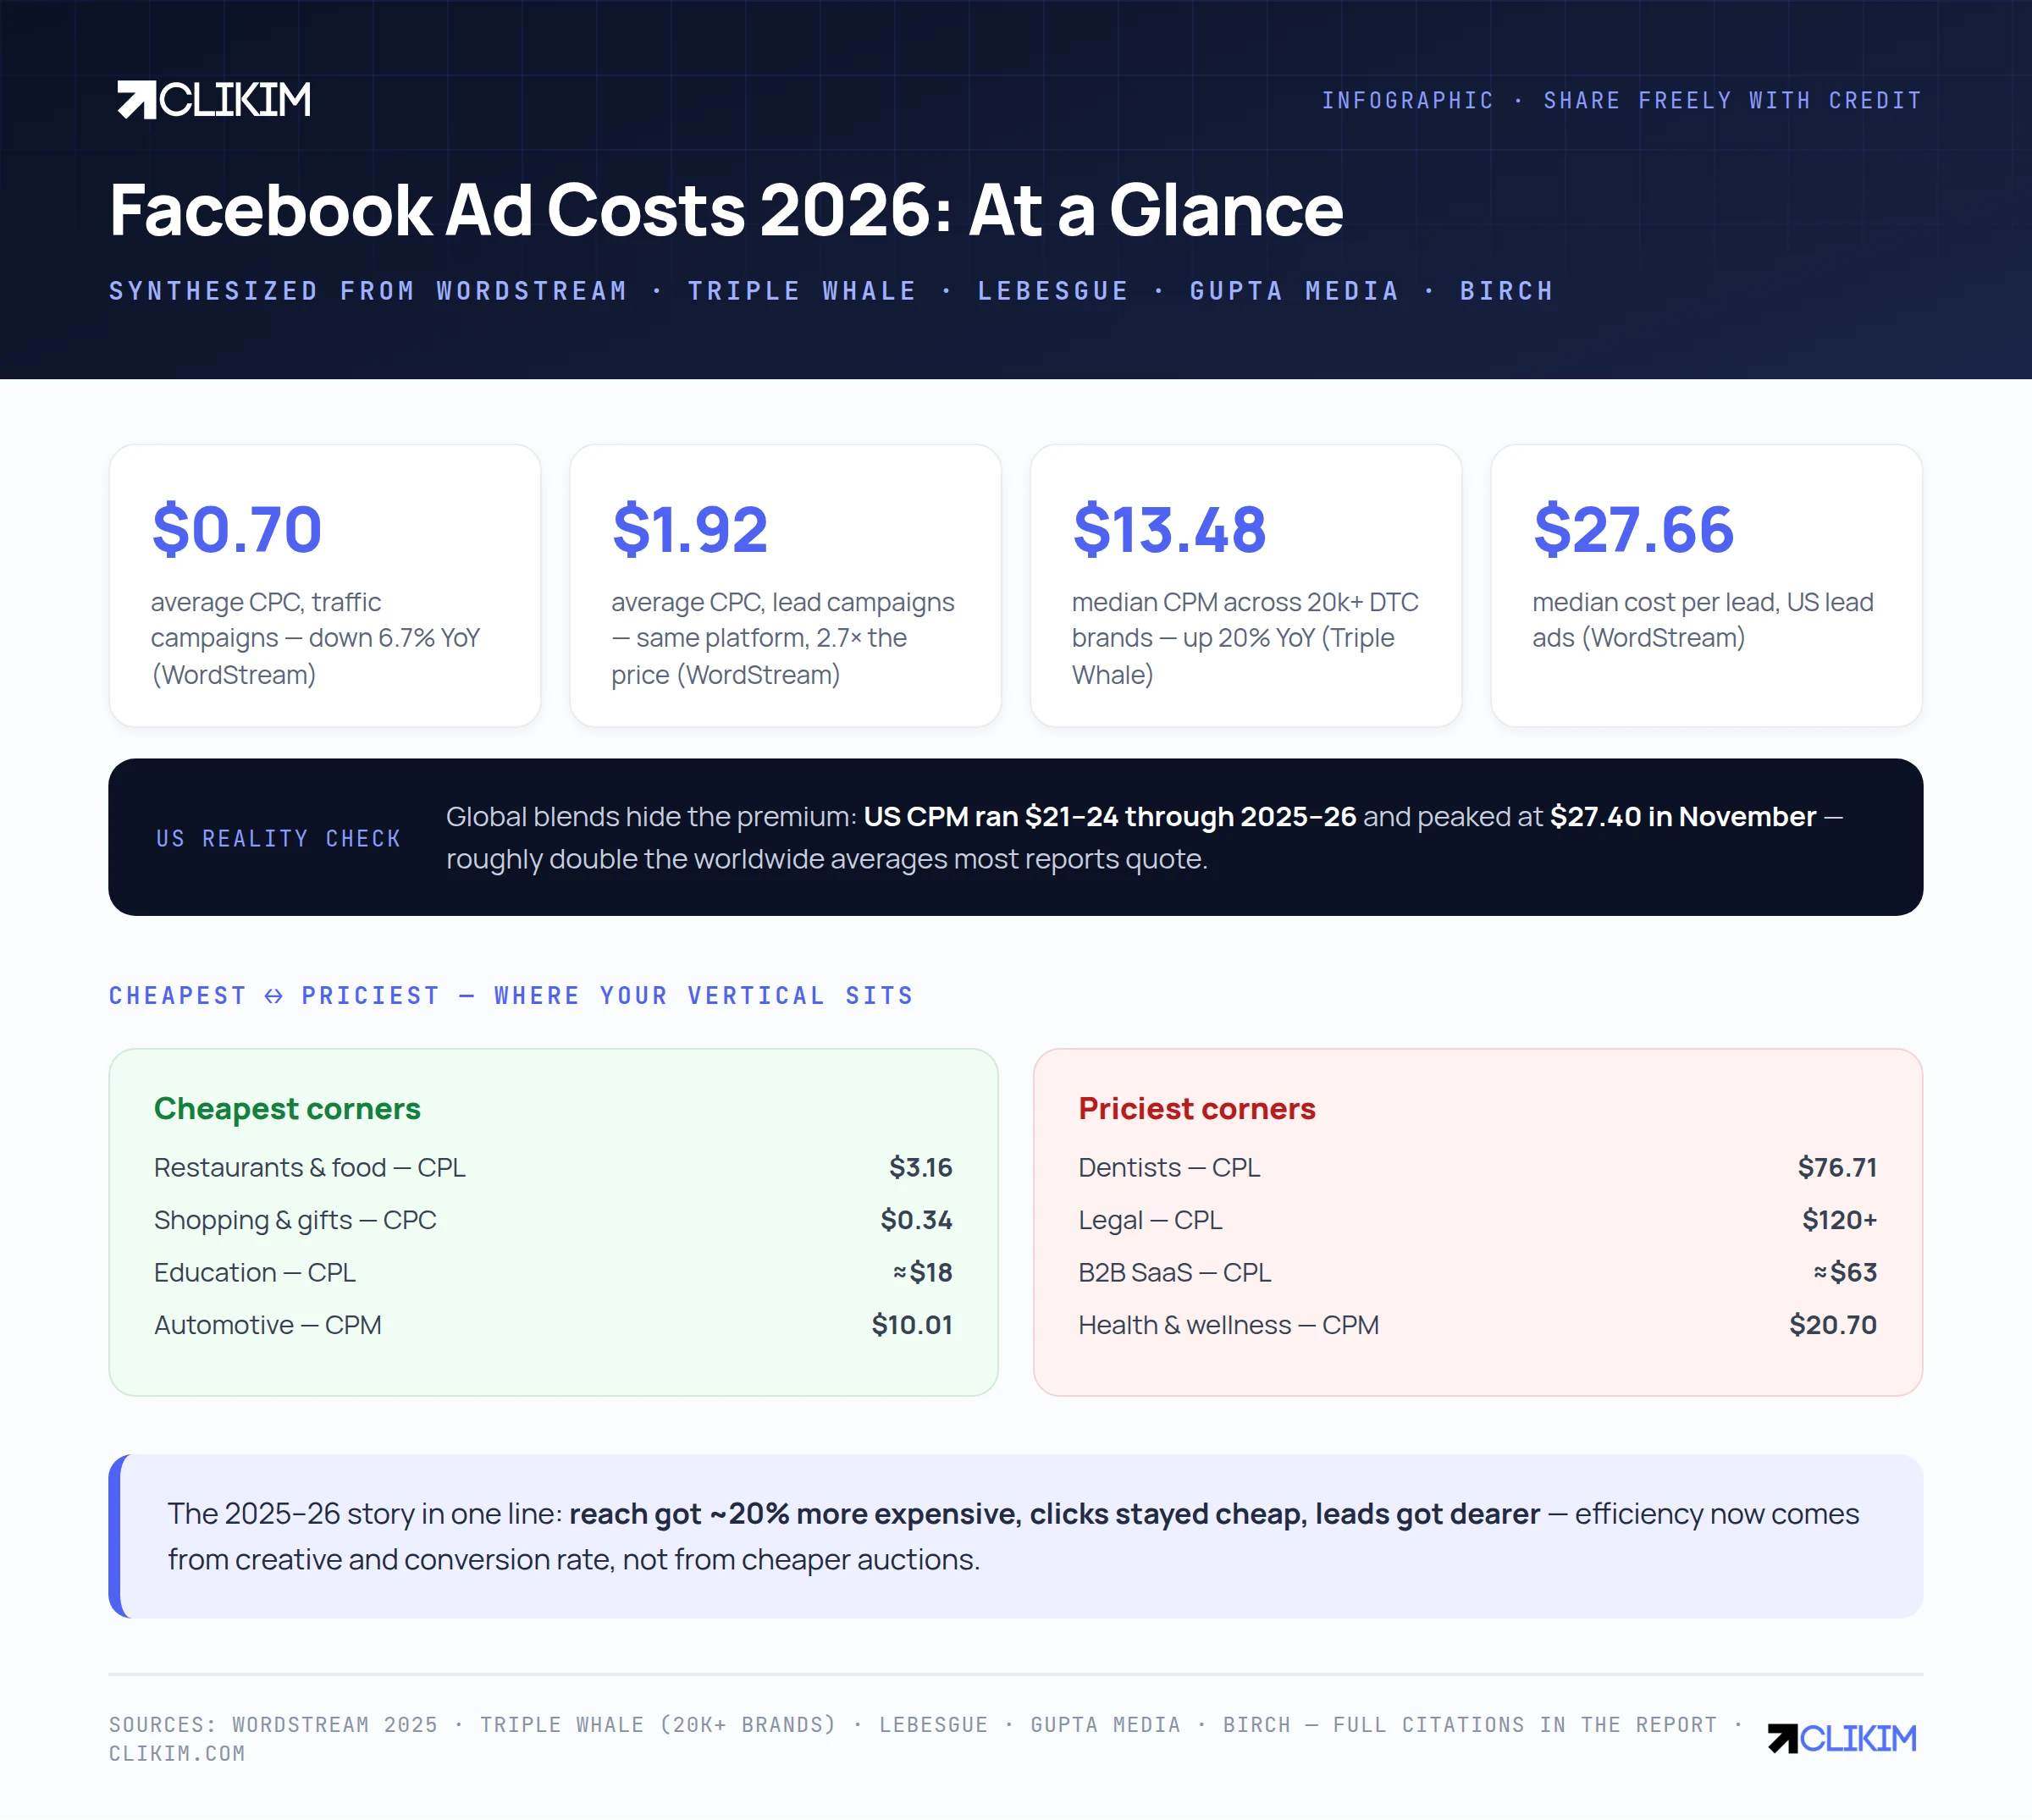
Facebook ad costs 2026 at a glance — synthesized from the major published datasets. Share freely with credit.
Why does every benchmark report show a different number?
Ask five datasets for the “average Facebook CPM” and you get answers from $10.88 to $23.87 — a 2.2× spread on the same metric, in the same period. None of them is wrong. They’re measuring different things.
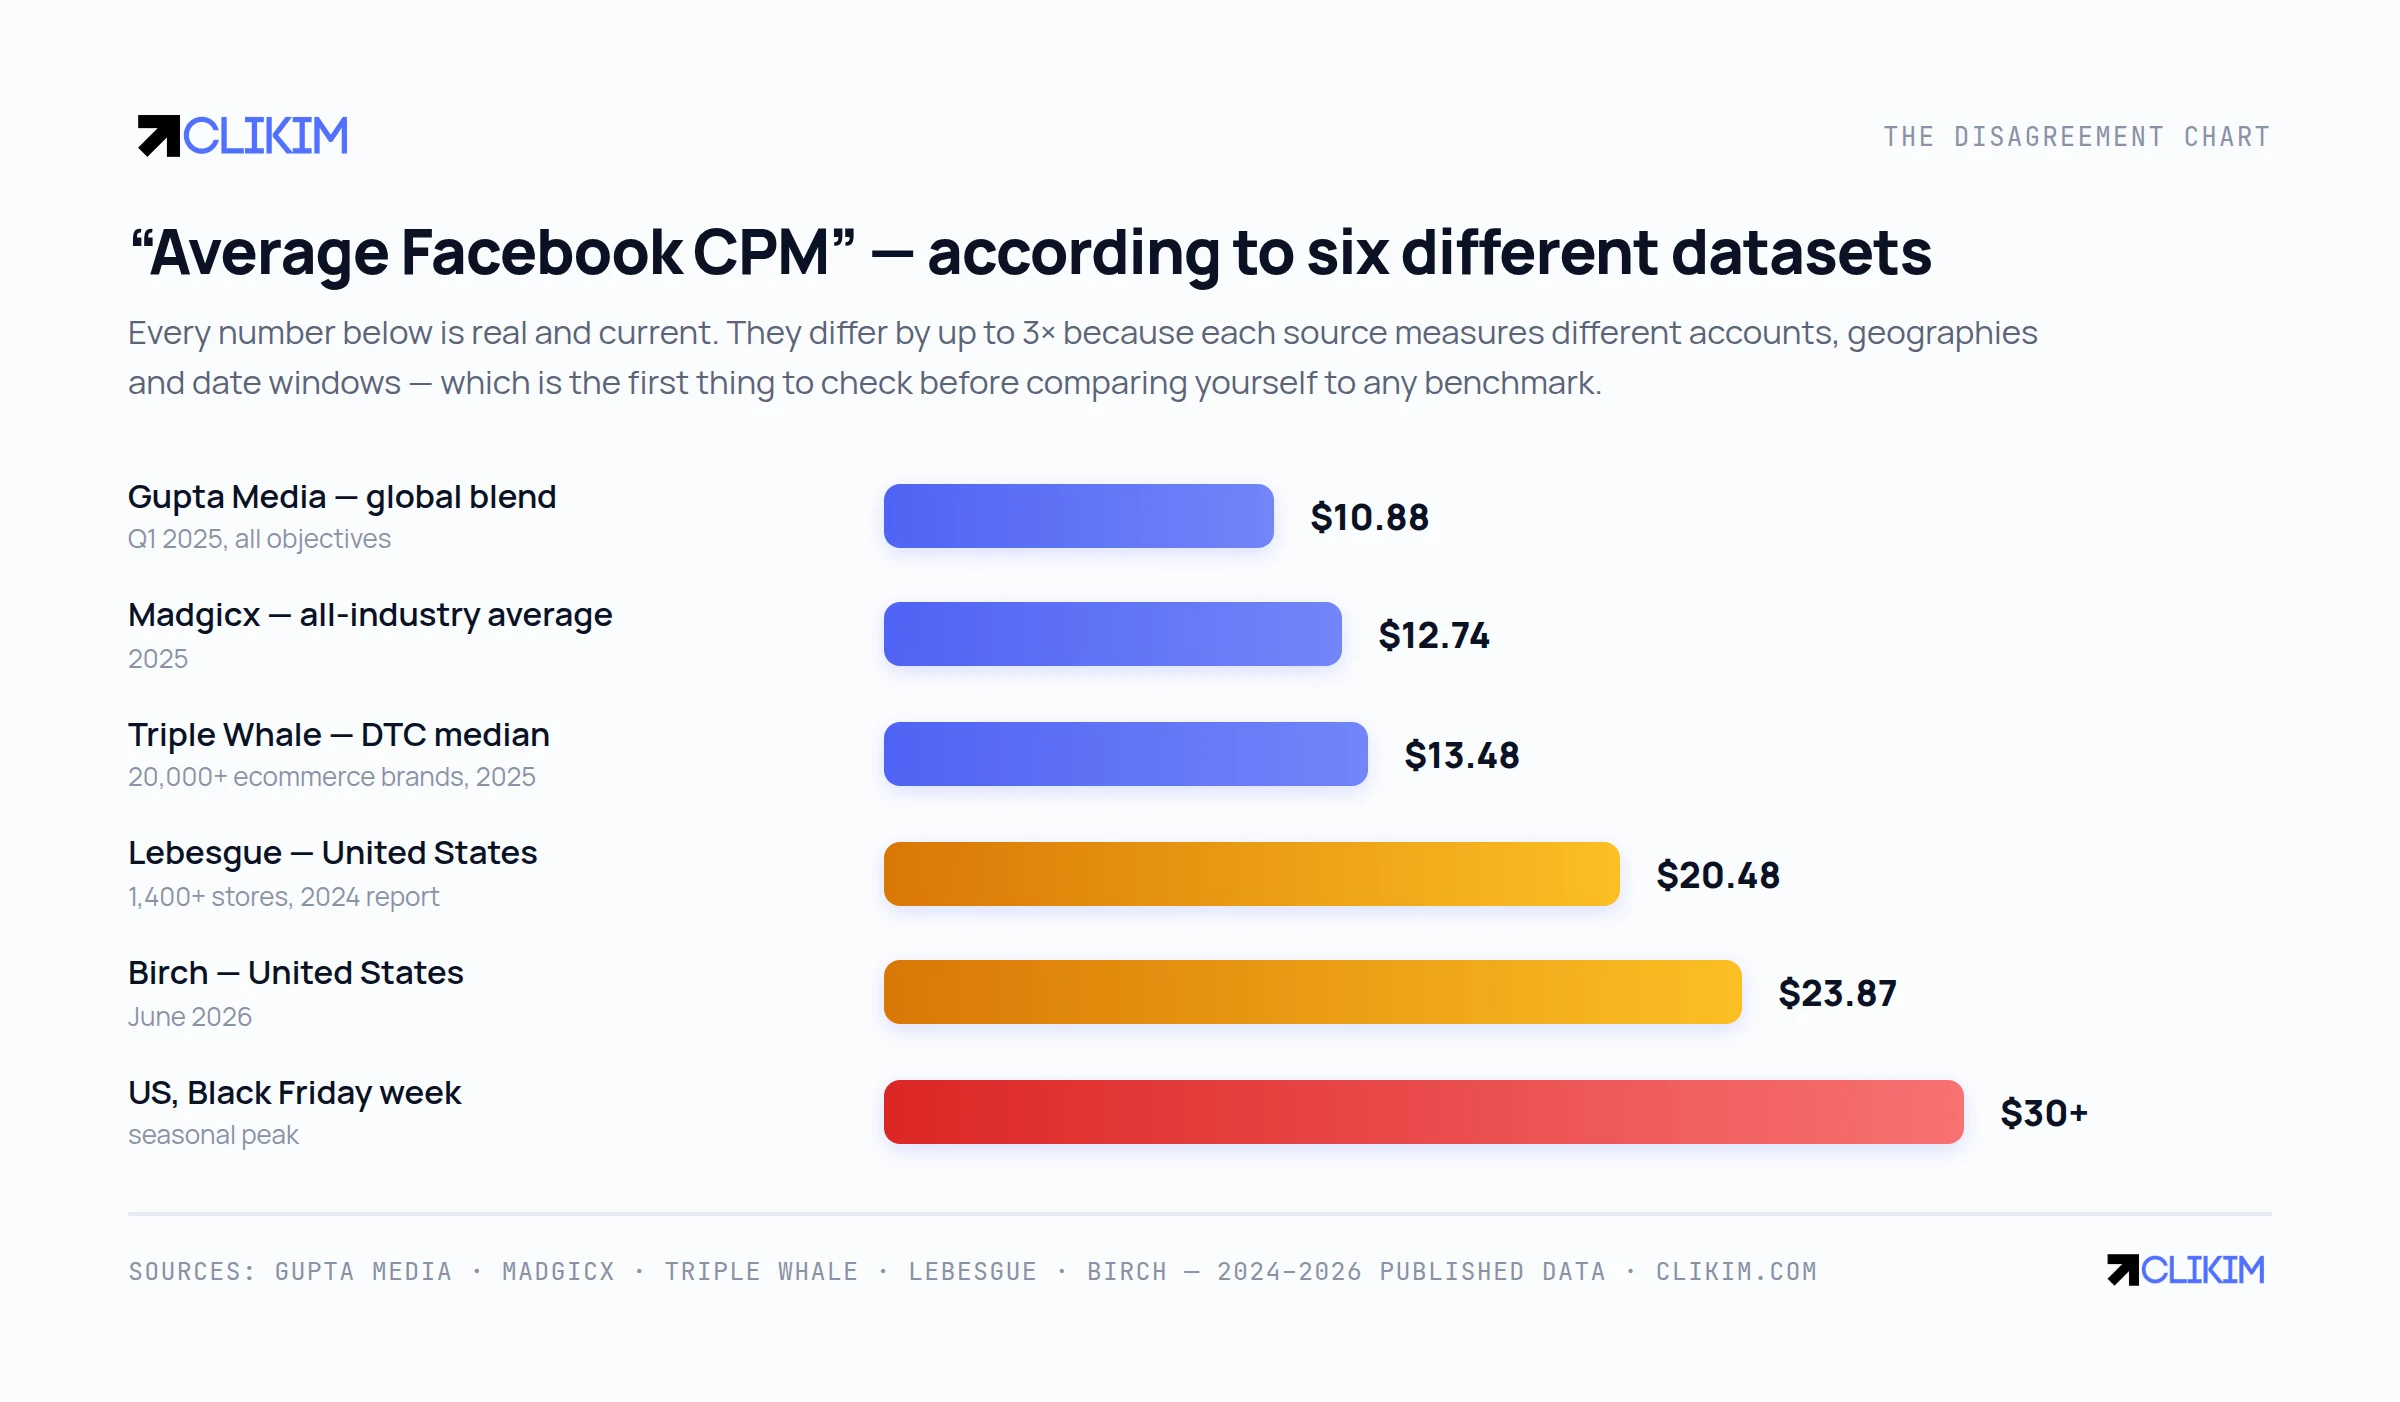
Six real, current answers to one question. The spread is the finding.
Three variables explain almost the entire disagreement. Sample: WordStream draws on US small-and-mid advertisers, Triple Whale on 20,000+ DTC ecommerce brands, Lebesgue on 1,400+ stores — different advertisers, different auctions. Geography: global blends fold in cheap impressions from low-CPM markets; US-only datasets don’t. Window: a Q1 number and a November number can differ by 50% inside the same account.
Here is who measures what — keep this table open whenever anyone quotes you a benchmark.
All figures as published by each source, 2024–2026. Full links in the methodology section.
The practical rule: benchmark against the dataset that looks like you. A US DTC brand belongs next to Triple Whale and Birch’s US line, not next to a global blend. A local lead-gen business belongs in WordStream’s tables. Comparing across lanes produces panic or complacency, both unearned.
What is the average Facebook CPM in 2026?
For US advertisers, the honest 2026 answer is $21–24 per thousand impressions, with Birch measuring $23.87 in June 2026 — up 11.7% year over year. DTC-blend medians sit lower at $13.48, and global blends lower still. If your CPM is under $15 on US traffic, you are beating the market, not losing it.
The direction matters more than the level. Triple Whale logged CPM up +20.03% in 2025 with every single tracked industry rising — the broadest cost inflation since the iOS-14 era. Health & wellness inflated hardest (+38% to a $20.70 median); automotive stayed cheapest at $10.01. Reach is the input that got expensive; nothing about your account is broken if your CPM crept up this year.
That said, CPM is also the metric your own inputs move most. Audience size, placement mix, frequency and creative fatigue can each swing it far more than the market trend does — we walk through the full diagnostic in why is my Facebook CPM so high.
What is the average cost per click on Facebook?
Two different markets share the name “CPC.” Traffic-objective clicks average $0.70 — and actually got 6.7% cheaper year over year. Lead-objective clicks average $1.92, because you’re bidding against everyone who wants form-fills, not everyone who wants visits. Quoting one “average Facebook CPC” without naming the objective is how most benchmark confusion starts.
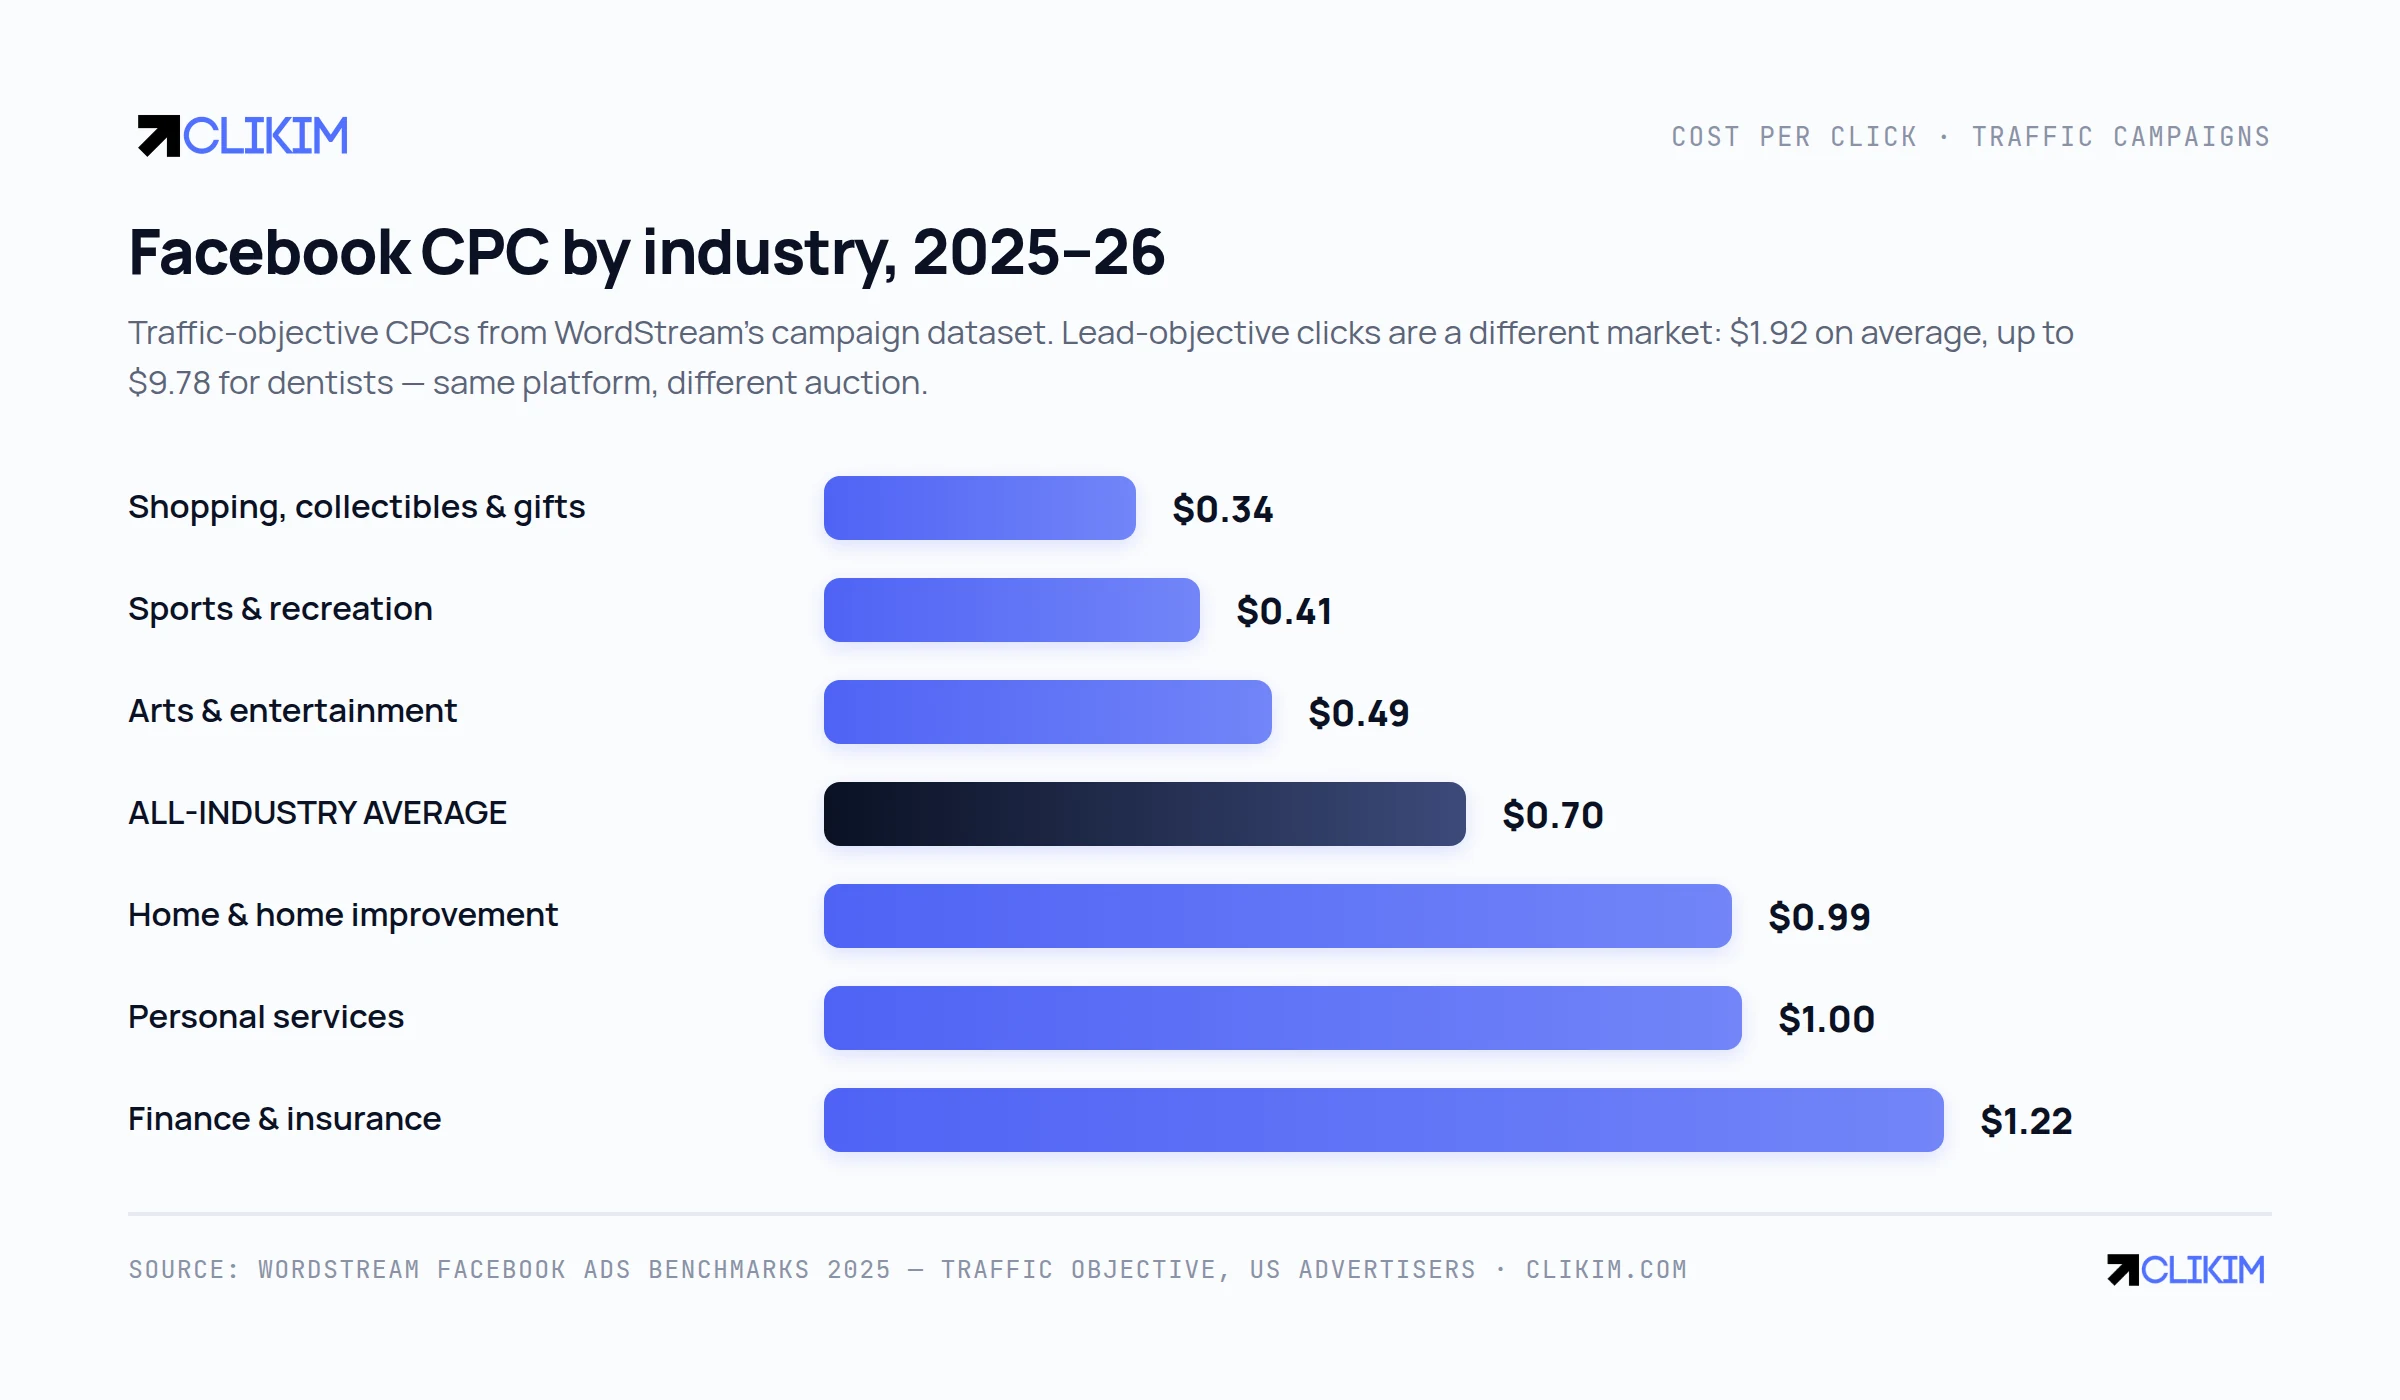
Traffic-campaign CPC by industry. Lead campaigns are a separate market at $1.92 average — up to $9.78 for dentists.
The industry spread is wide but logical. Impulse-friendly categories — shopping and gifts ($0.34), sports and recreation ($0.41) — get cheap clicks because anyone can be tempted. Considered, high-stakes categories — finance and insurance at $1.22 — pay for scarcer intent. The full breakdown, including how CPC interacts with CTR, is in our average Facebook CPC guide.
One trap worth naming: since Meta’s March 2026 reporting change, “clicks” in some views means link clicks only, which mechanically raises reported CPC without anything real changing. Check which click definition your report uses before comparing across the change line.
What does a Facebook lead cost in 2026?
The US median is $27.66 per lead (WordStream), with a global all-industry benchmark near $41. The spread across verticals is enormous — a 38× gap separates restaurants ($3.16) from legal ($120+) — and it tracks lead value, not advertiser skill. A signed legal client is worth thousands; a booked table is worth forty dollars. The auction prices accordingly.
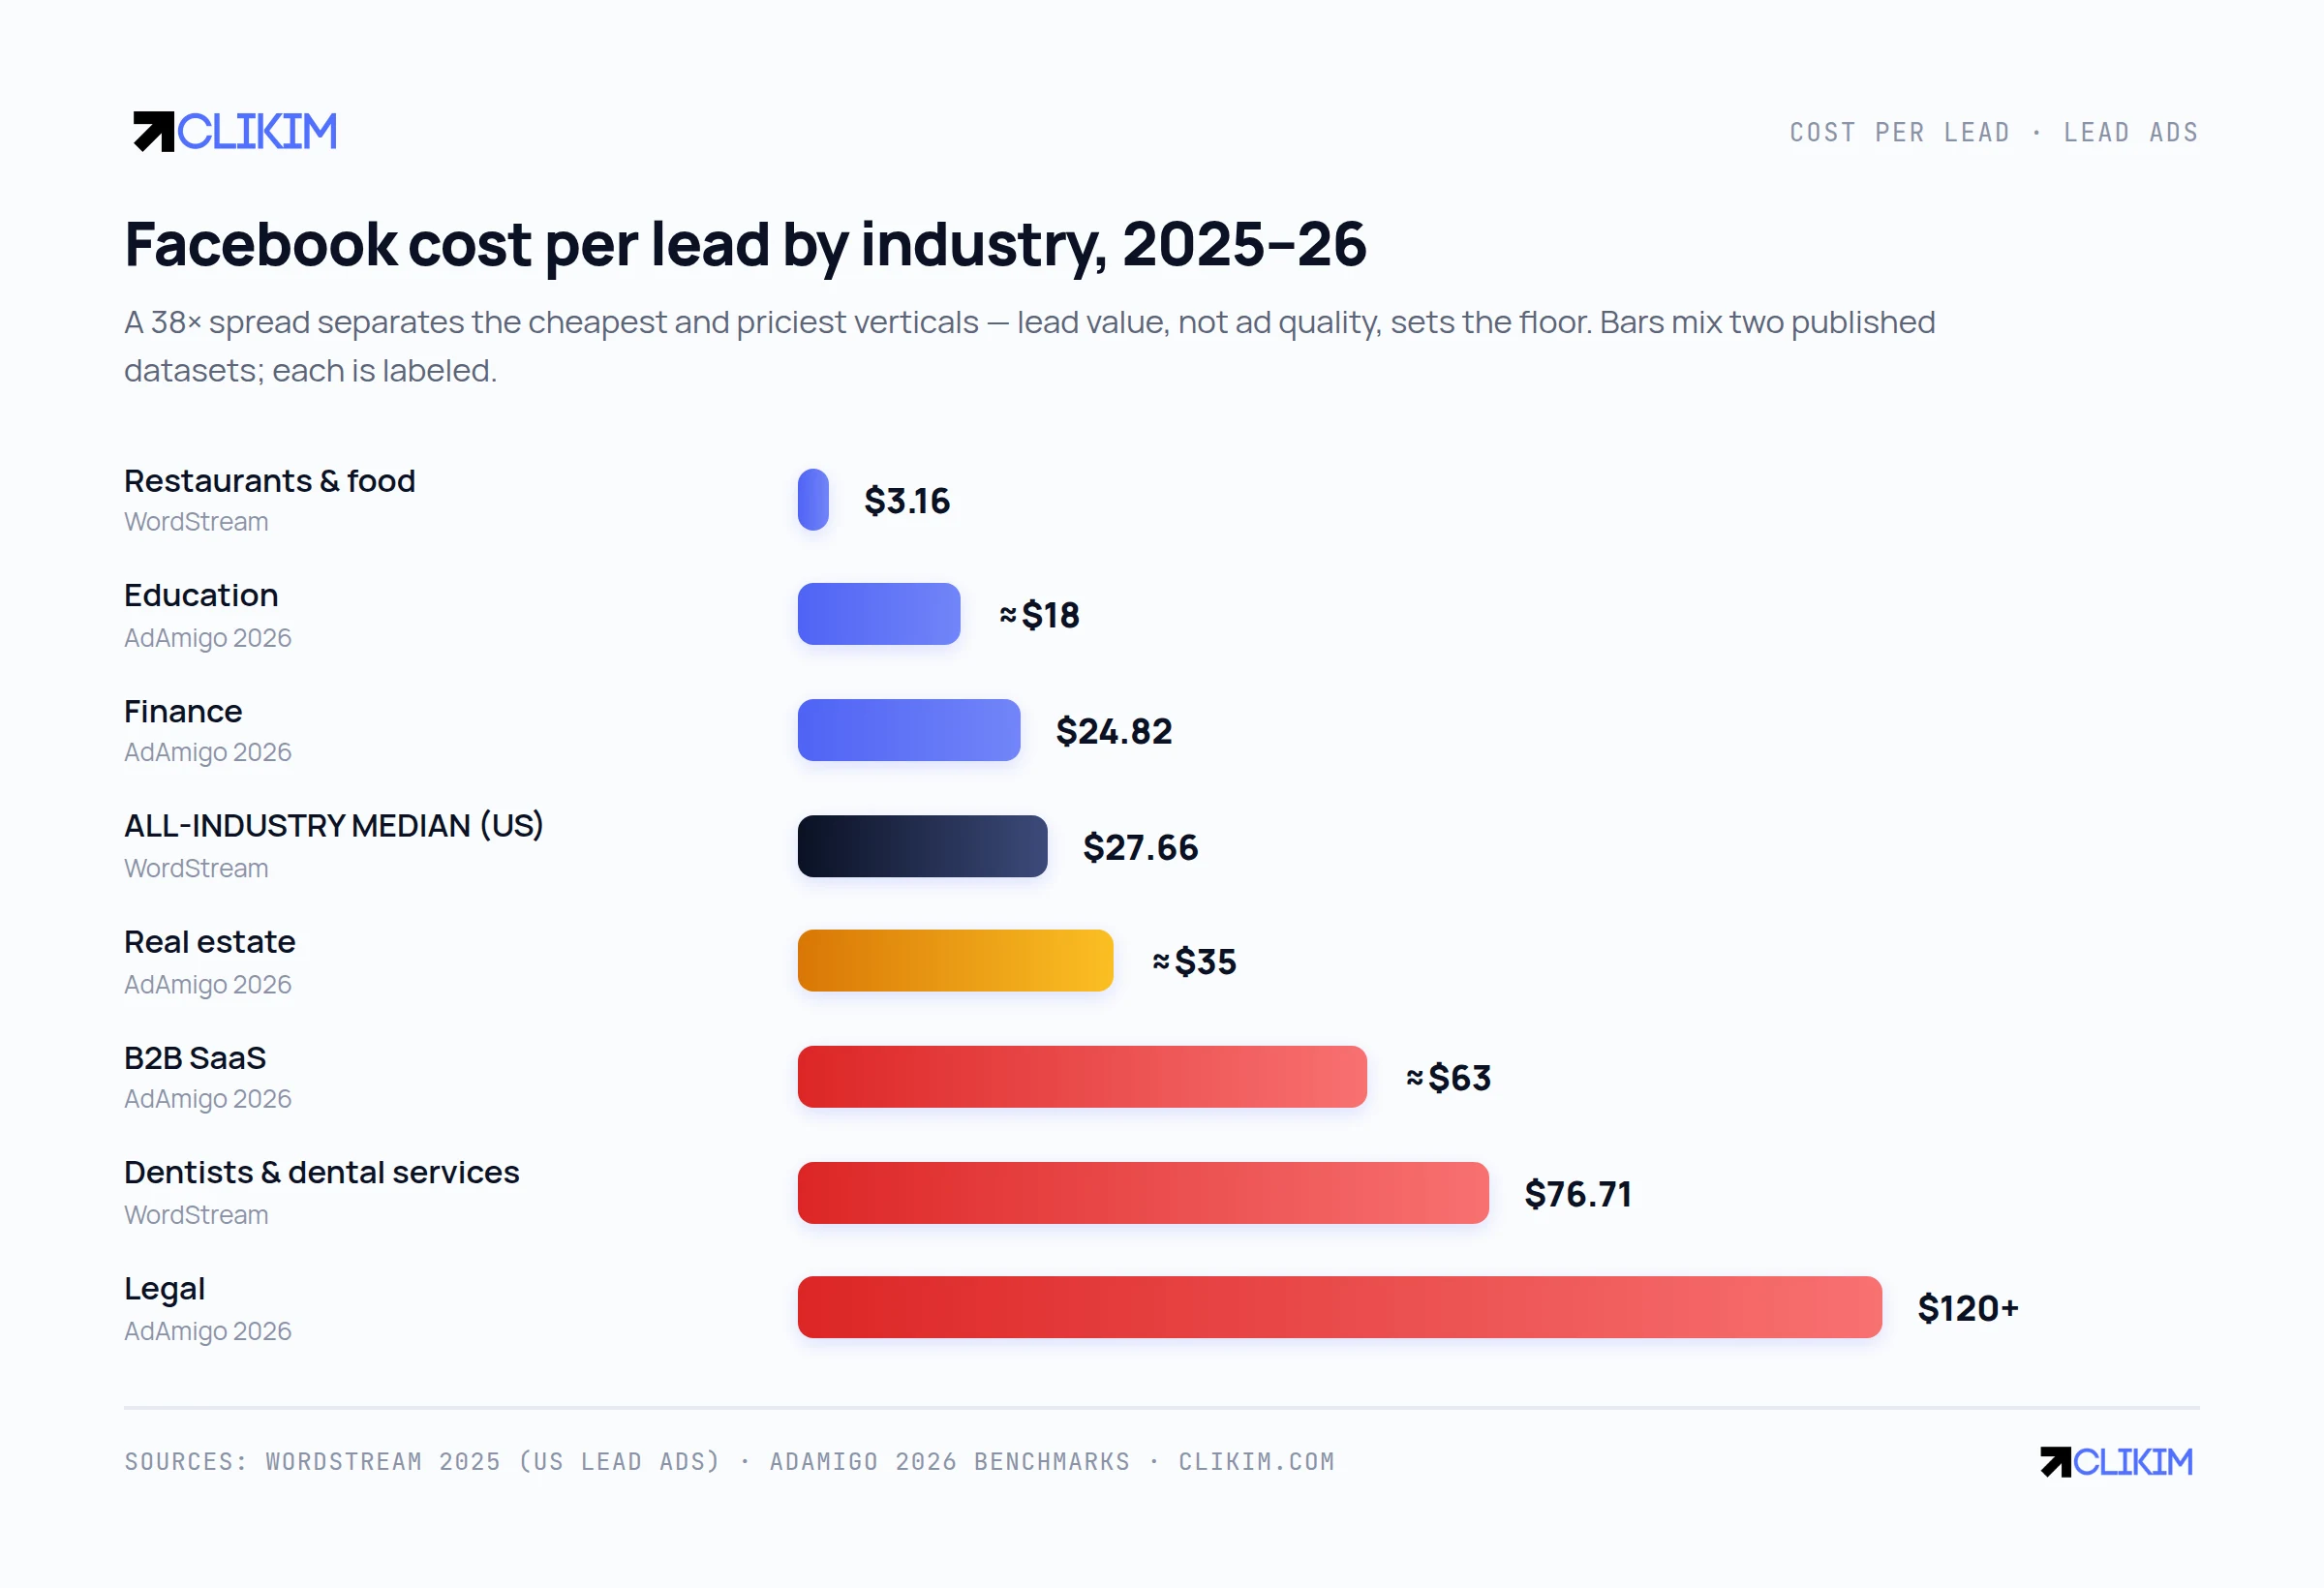
Cost per lead by industry, 2025–26 — two published datasets, each bar labeled.
Costs are also drifting up: AdAmigo’s dataset forecasts CPL rising ~11% from 2025 to 2026, with finance already up 24% year over year by January. And CPL is fiercely seasonal — the 2025 low arrived in March ($33.43 global) and the high in October ($48.83), a 46% swing that has nothing to do with your funnel.
Two levers matter more than any bidding trick. First, lead type: instant forms produce cheaper, lower-intent leads than landing-page conversions — the benchmark you compare against must match the mechanism you use. Second, budget adequacy: chronically underfunded lead campaigns never exit learning; our guide to daily budgets covers the floor that makes lead costs stabilize.
What is a good CTR for Facebook ads in 2026?
The all-industry average for traffic campaigns is 1.71%, up from 1.57% a year earlier; lead campaigns average 2.59%. If you clear 2% on cold traffic you are comfortably above average; under 1% means the creative, not the audience, usually needs the work.
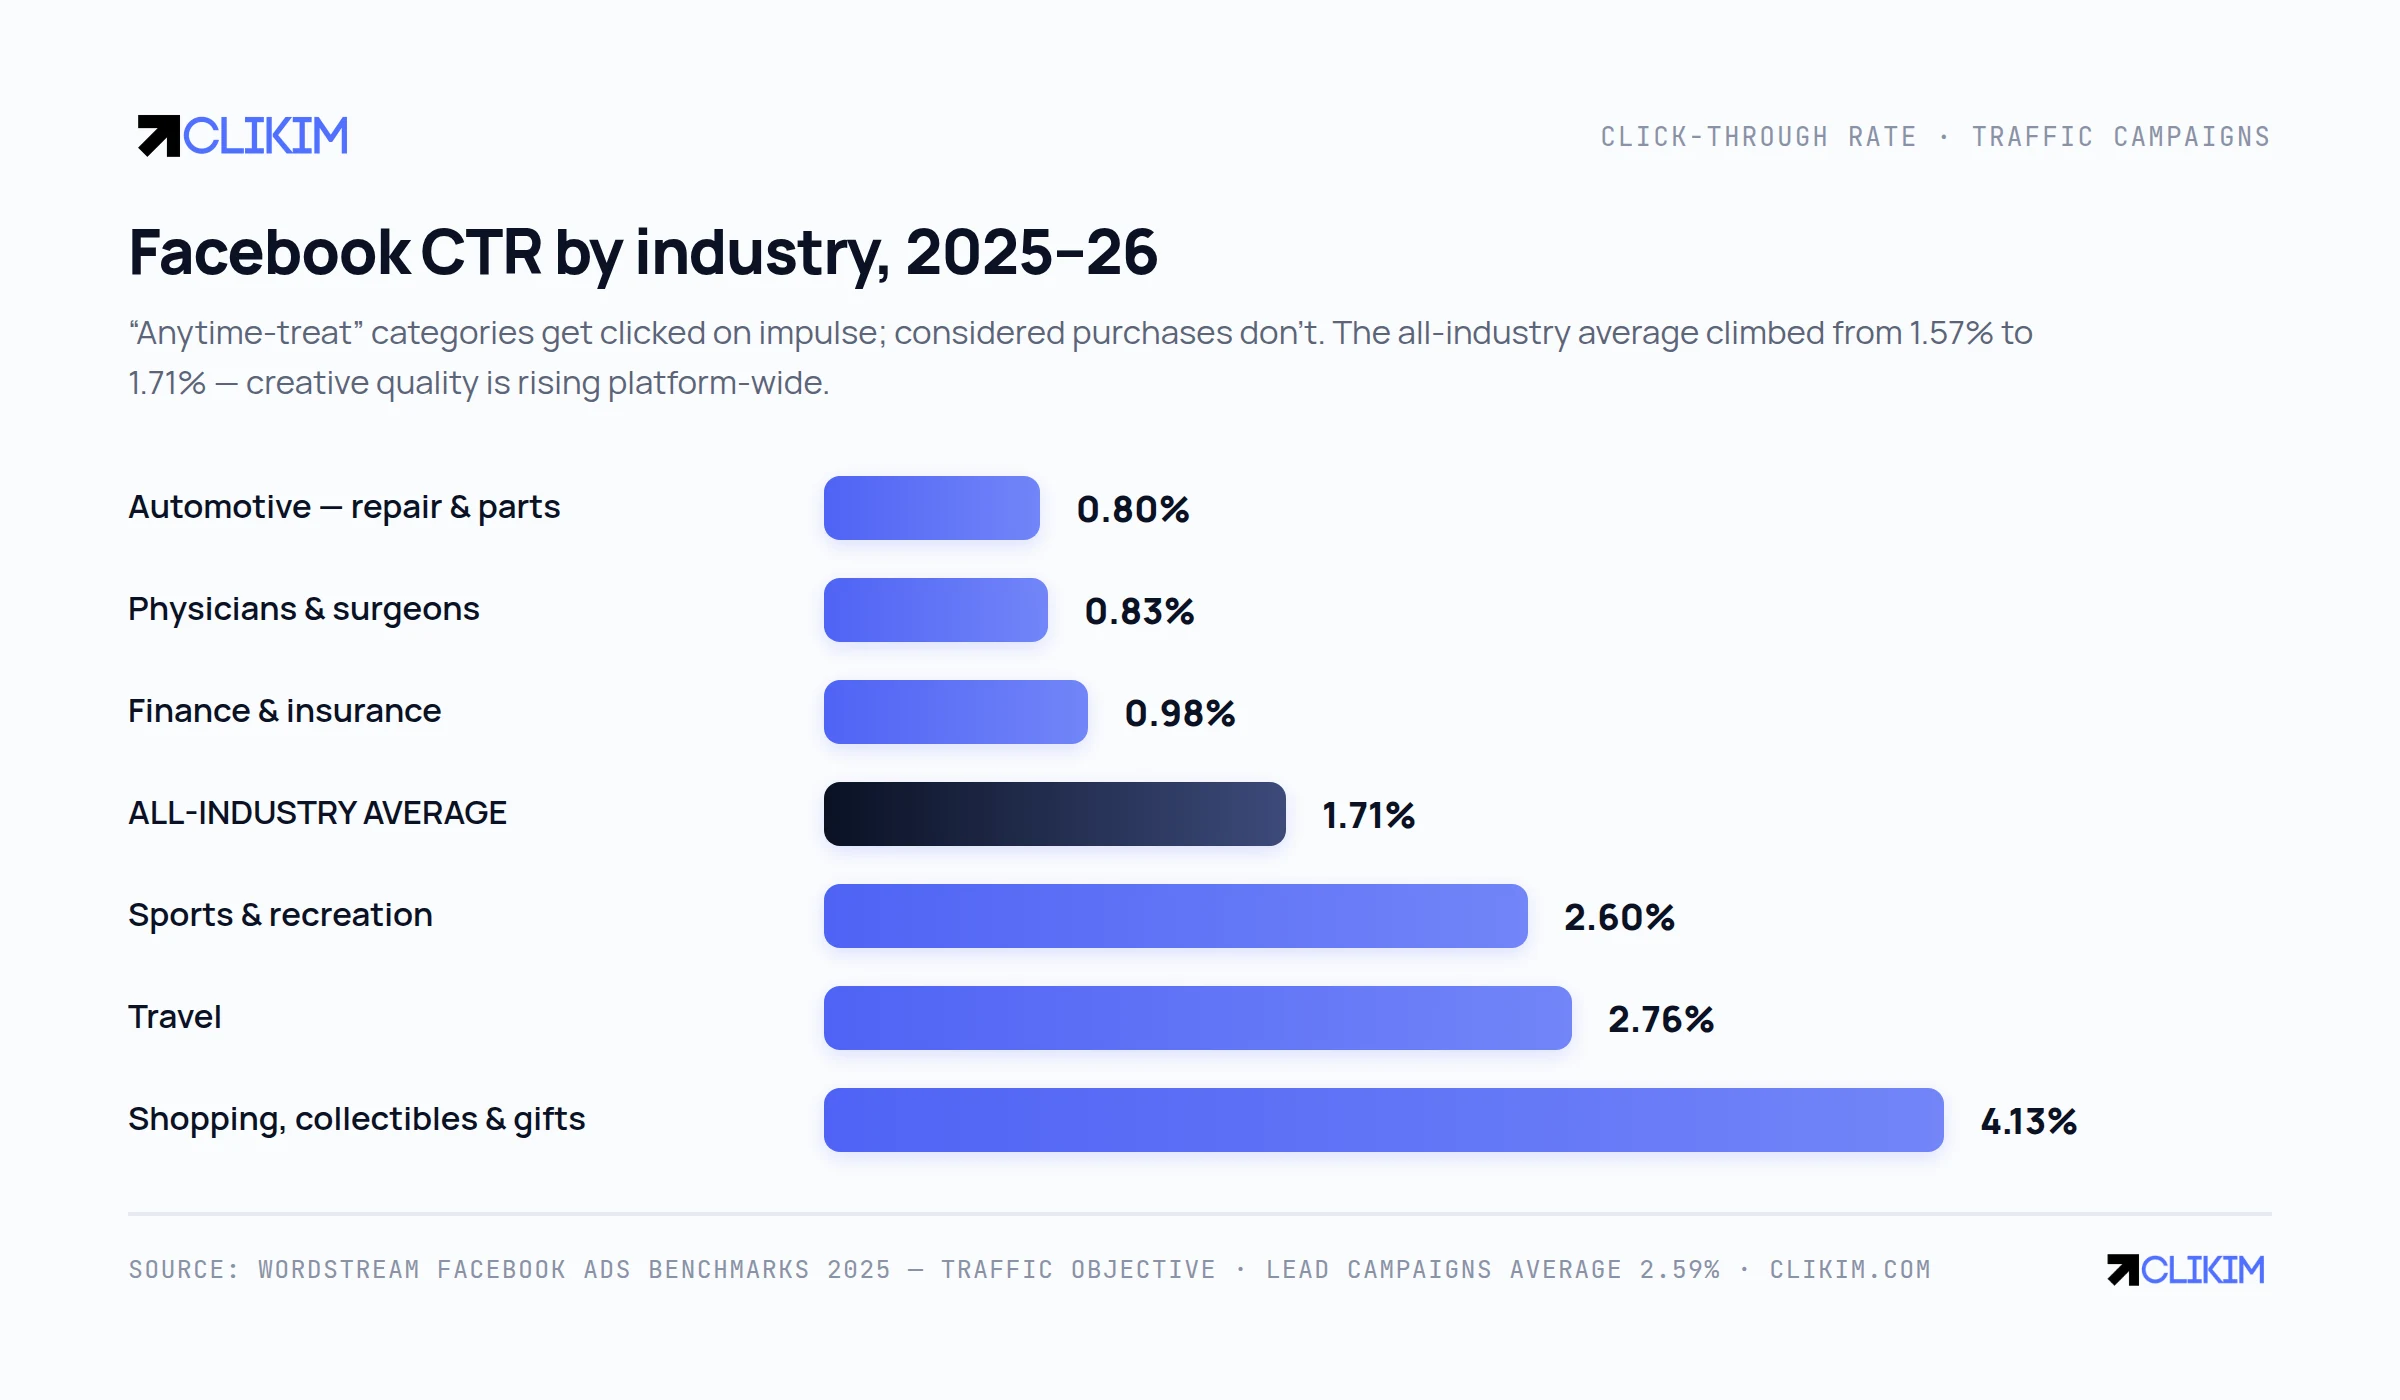
CTR by industry, traffic objective. “Anytime-treat” categories get impulse clicks; considered purchases don’t.
Industry position explains most of the gap before skill enters. Shopping and gifts run 4.13% because anyone can be tempted mid-scroll; automotive repair runs 0.80% because nobody clicks brake-pad ads recreationally. Benchmark inside your industry, and treat the platform-wide rise as the real signal: creative quality is climbing everywhere, and CTR is the clearest proxy for whether yours is keeping up.
What about cost per purchase and ROAS?
Purchase-side benchmarks come almost entirely from ecommerce trackers, so treat them as DTC numbers. Triple Whale’s median CPA is $38.17 across industries. On returns, Varos medians cluster around 2.4–2.9× ROAS depending on vertical, and Billo’s analysis of 80,000+ Meta video ads in H2 2025 landed at 2.41× — reassuringly close, given the sources are independent.
Two honesty notes before you benchmark against any of them. These are platform-attributed figures, and attribution settings changed materially in 2026 — a “ROAS drop” across the January line is often a measurement change, not a performance change. And ROAS medians conceal survivor bias: accounts that fail exit the dataset. A 2.4× median does not mean the typical new advertiser achieves 2.4×.
How have Facebook ad costs changed from 2023 to 2026?
The short version: costs drifted down through 2023–24, reversed hard in 2025, and settled into slower inflation in 2026. Advertisers who formed their price instincts in 2024 are the ones who feel most gaslit by today’s auction — their baseline was the bottom.
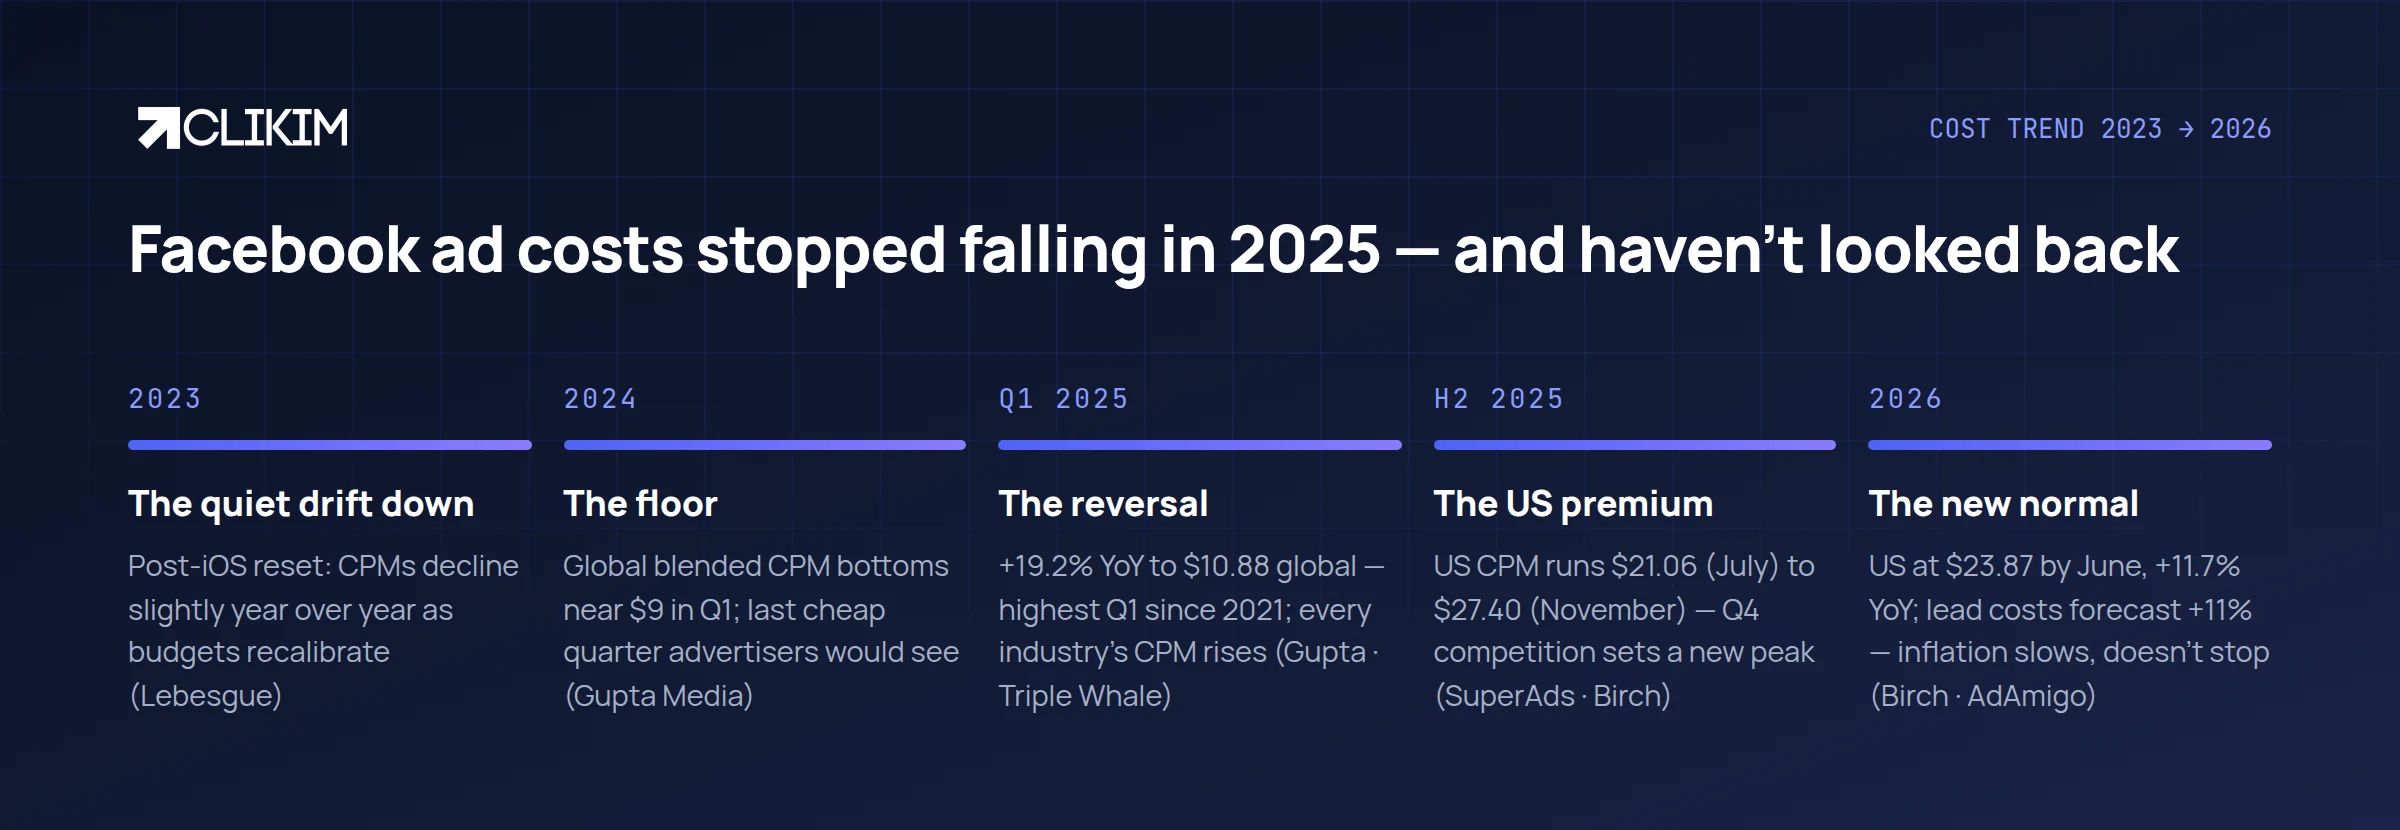
The cost story 2023 → 2026: a quiet drift down, a hard reversal, a new normal.
Why the 2025 reversal? Three forces stacked: ad load stopped growing as fast as advertiser demand; AI-driven campaign types (Advantage+ and its successors) made spending easier and pushed more budget into the same auctions; and Reels monetization matured, which absorbed some pressure but not enough. The result — roughly +20% CPM in 2025, +11.7% into mid-2026 (US) — reads less like a spike and more like a repricing.
Planning implication: build cost inflation into next year’s targets. Holding this year’s CPA flat while CPMs rise ~10% is not “maintaining performance” — it is quietly demanding a 10% efficiency gain from creative and conversion rate. Say that out loud in the plan, and fund it.
Which industries pay the most — and least?
Ranking every vertical across the CPC, CPM and CPL tables produces a remarkably stable ladder. Position on it is mostly destiny — set by lead value and competition — but knowing your rung stops you from chasing another industry’s numbers.
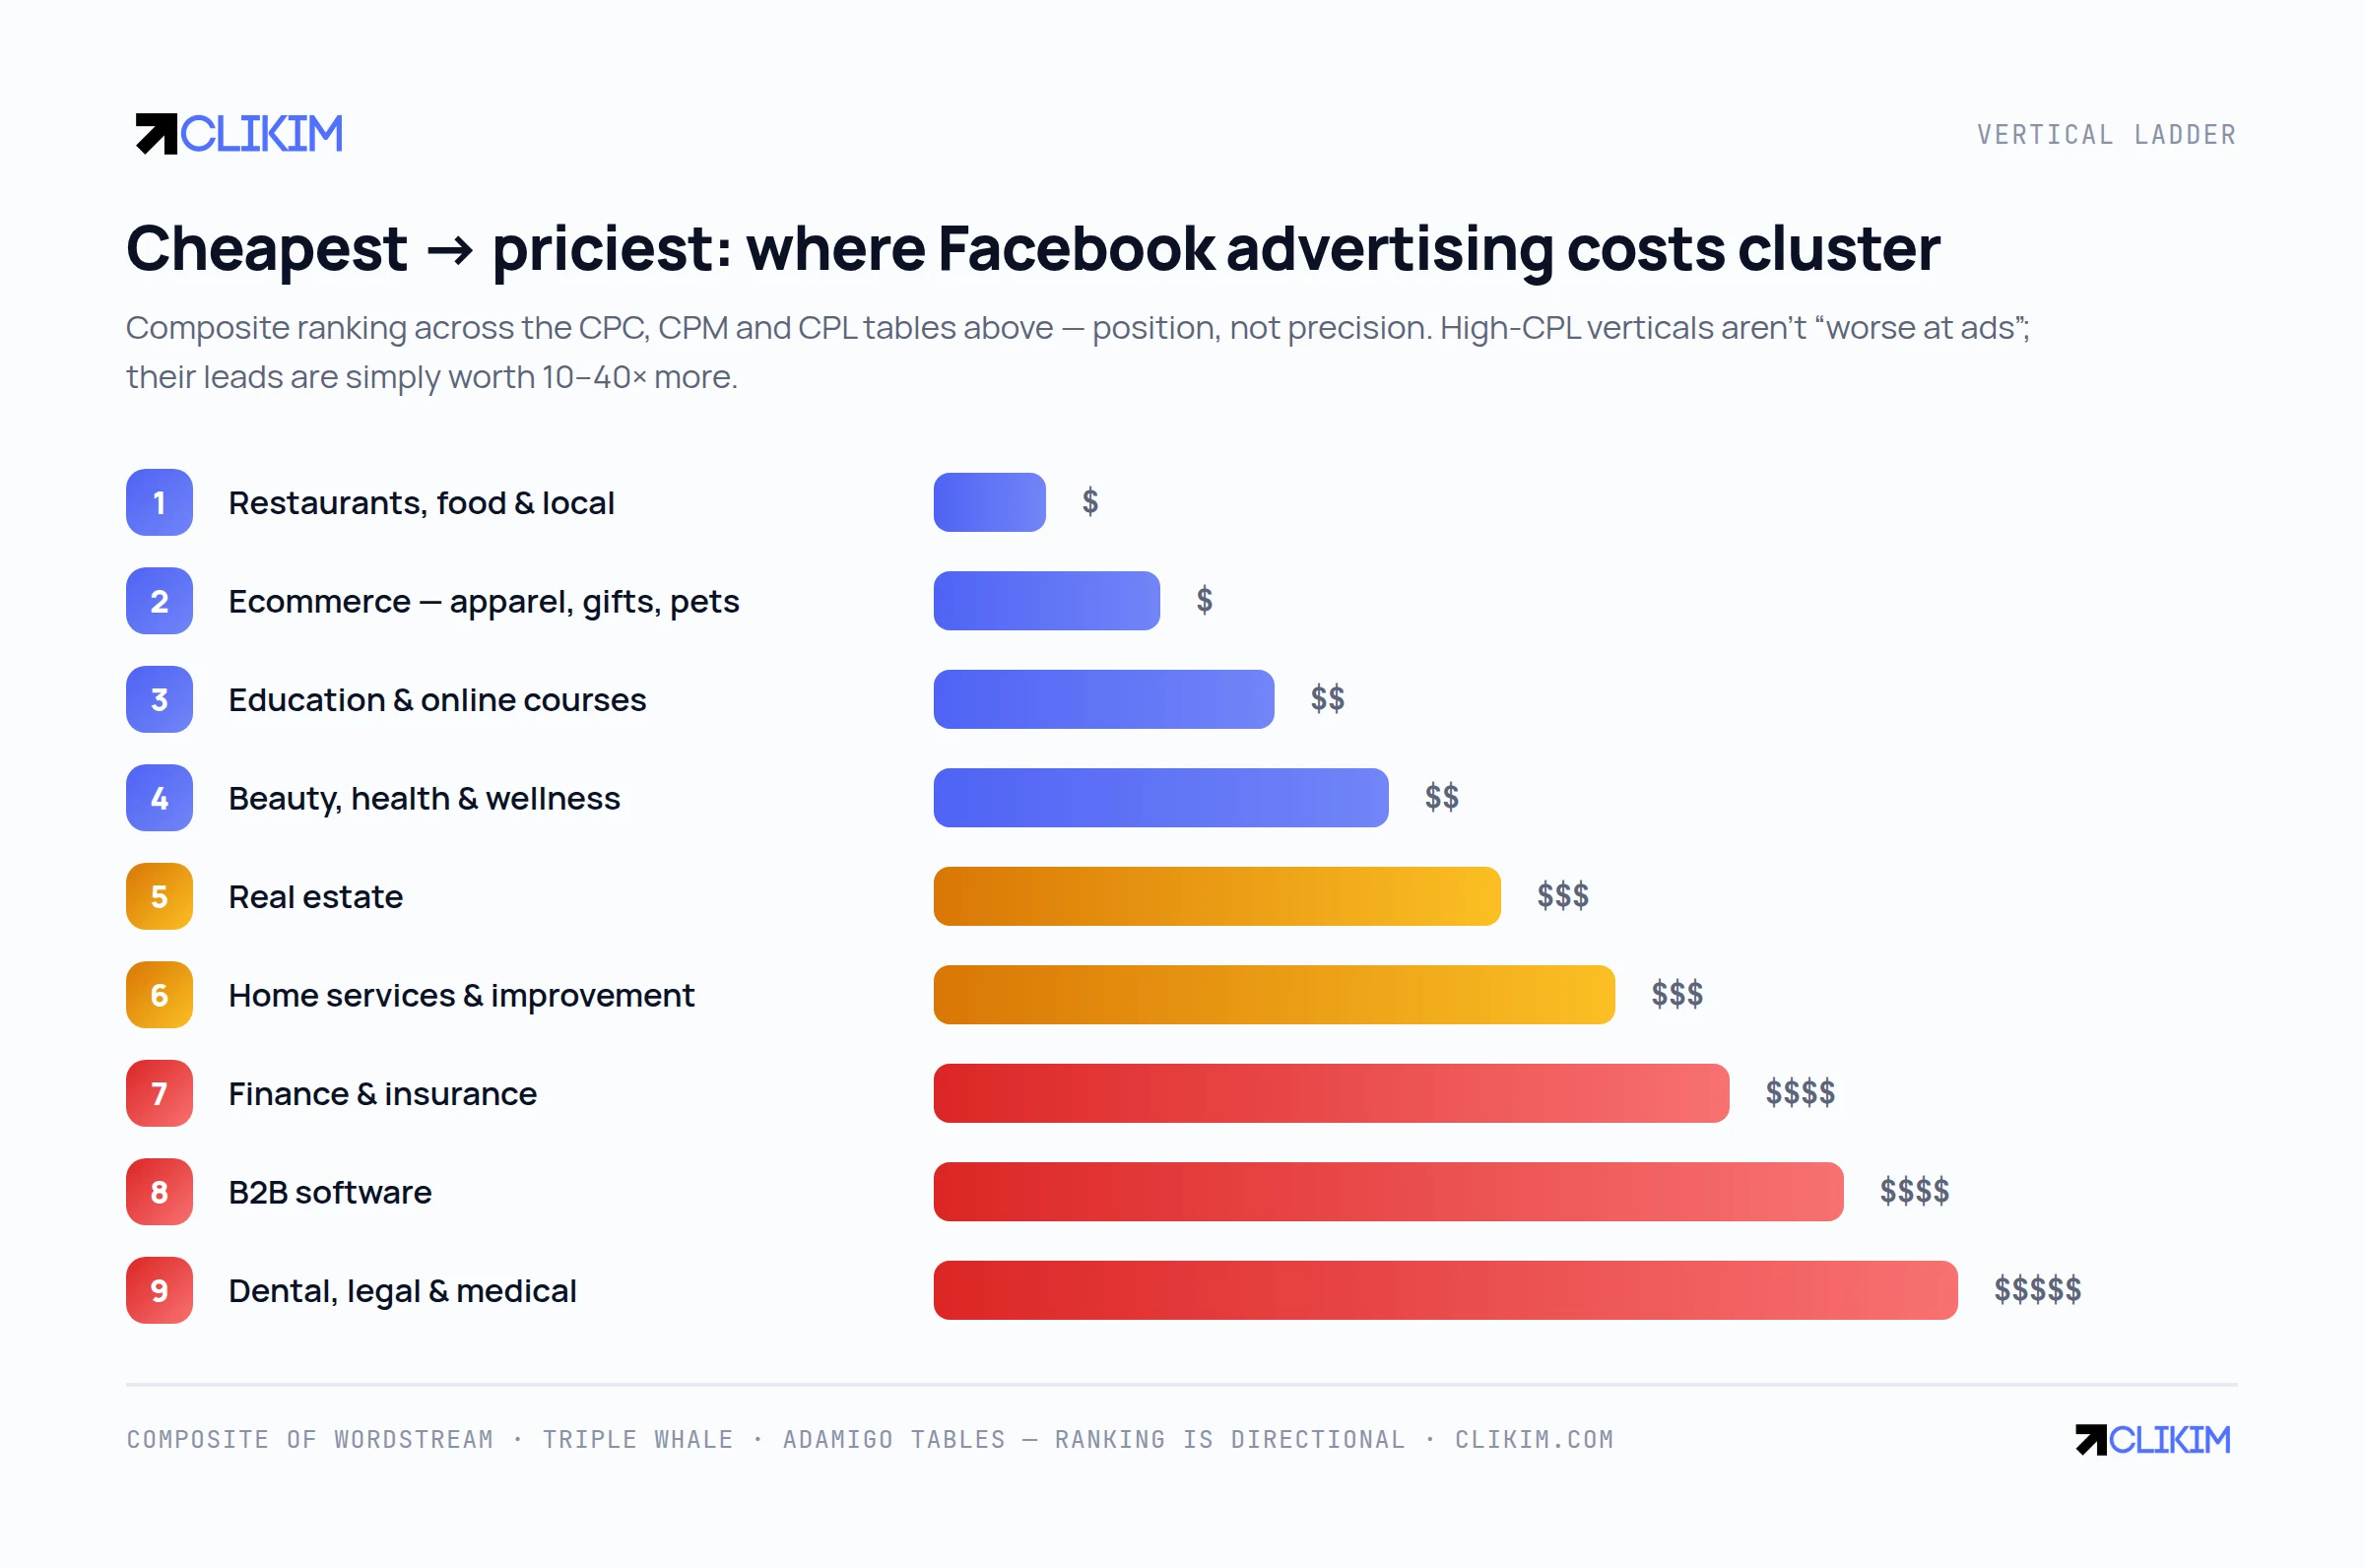
The vertical ladder — a composite ranking across the cost tables above. Position, not precision.
The pattern behind the ladder: cost tracks customer value, not ad difficulty. Dental, legal and B2B software sit at the top because one customer funds hundreds of clicks; restaurants sit at the bottom because the auction knows a table booking is worth forty dollars. High-CPL verticals compensate with high close values — which is why a $120 legal lead can be a bargain and a $3 restaurant lead can be a waste.
If you operate in a restricted or high-scrutiny vertical, cost is only half your problem — enforcement risk compounds it. That side of the equation lives in our 2026 ban report, this report’s companion pillar.
When are Facebook ads cheapest — and most expensive?
The cheap window is Q1 after the second week of January, when holiday budgets exit and inventory stays high; the 2025 CPL low landed in March. The expensive window runs late October through Christmas: CPMs lift 20–50% across markets, US Black Friday week clears $30, and costs fall roughly 20% the moment December’s gift deadline passes.
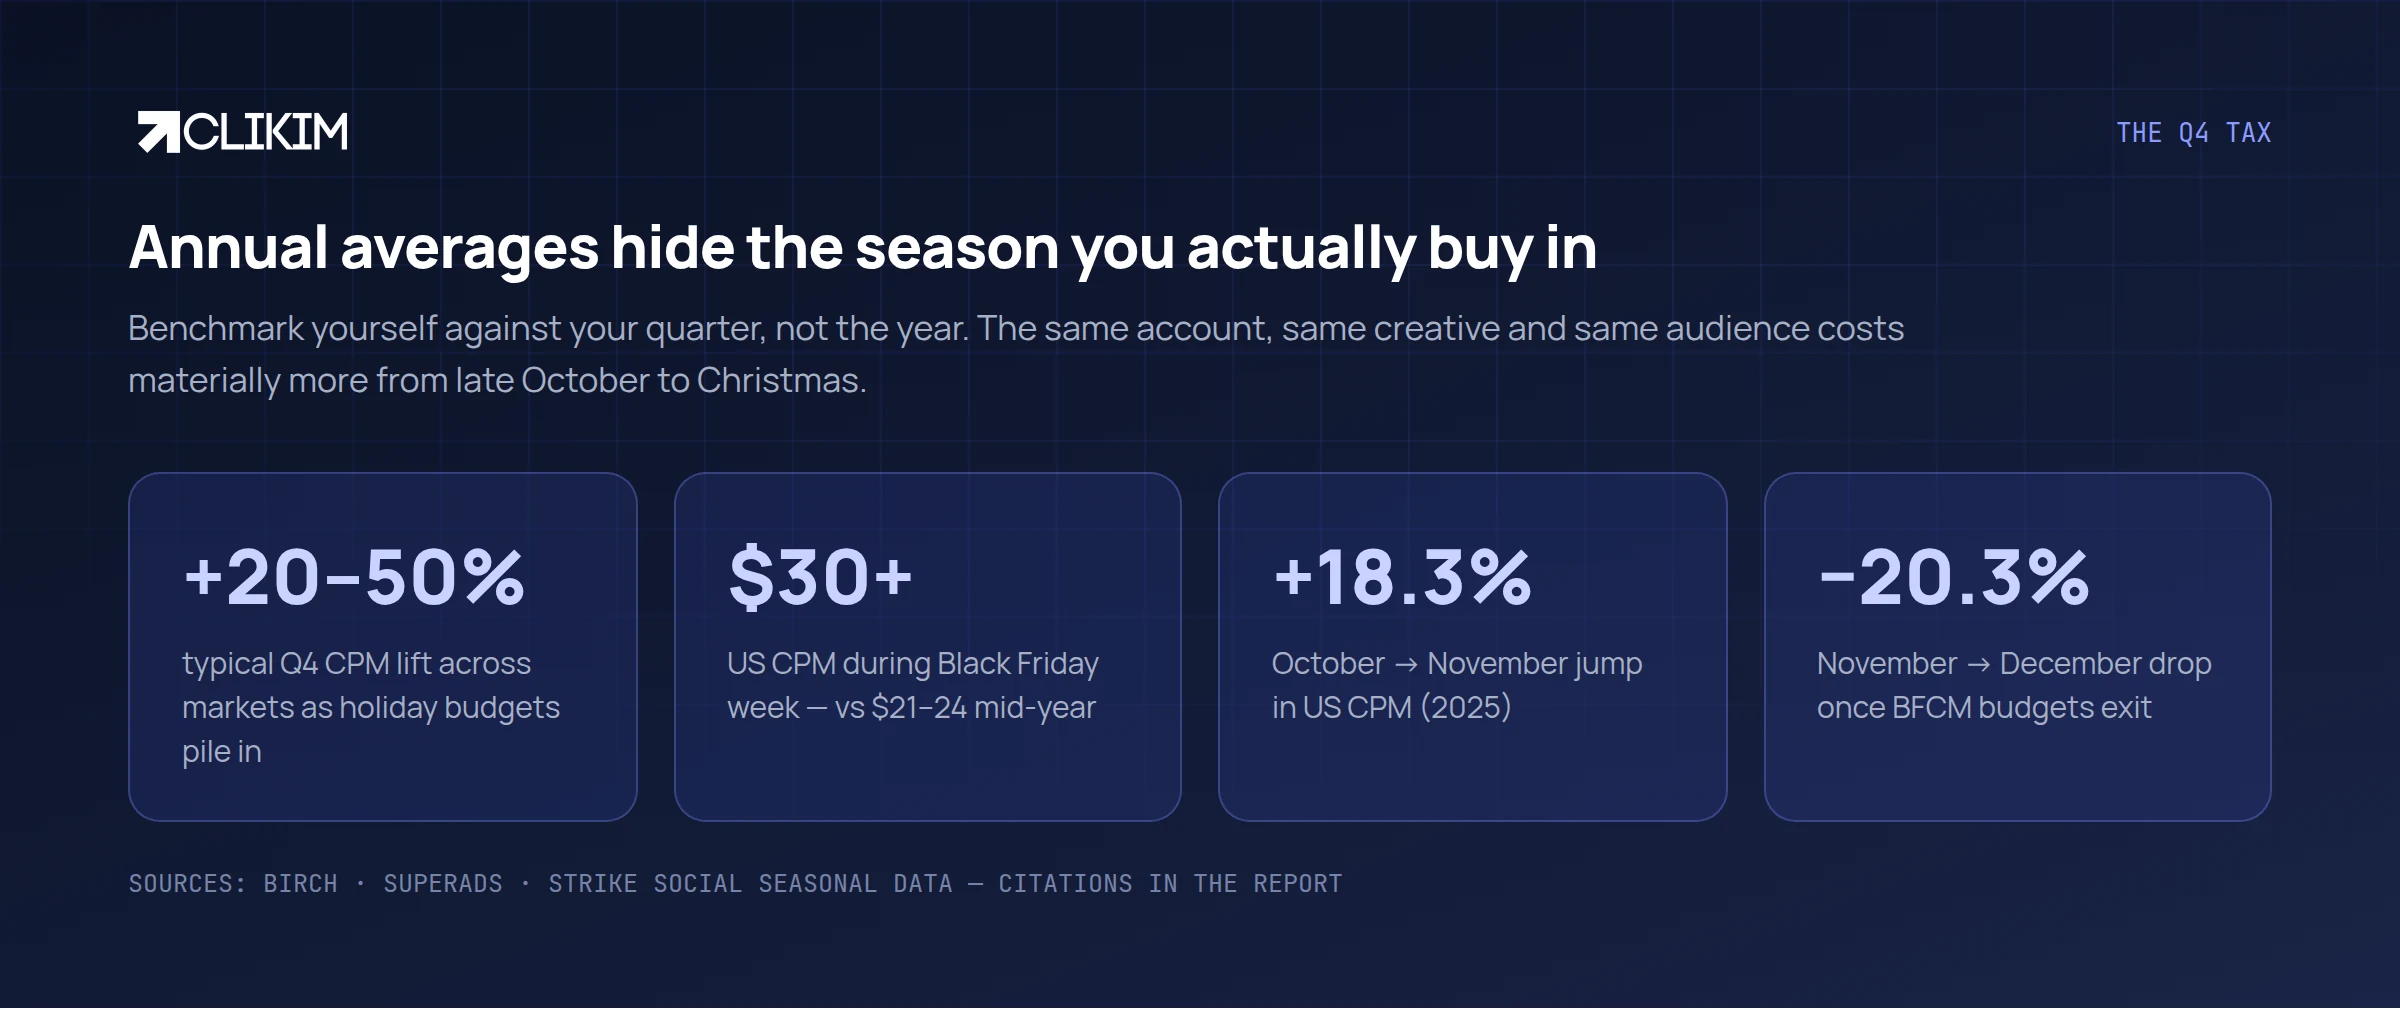
The Q4 tax — benchmark against your quarter, not the year.
Two ways to use the calendar. If you sell gifts, Q4 costs are the price of being where demand is — pay them, but pre-build audiences in cheap October weeks so you enter auctions warm. If you don’t, the contrarian windows (late Q1, midsummer) offer the year’s cheapest testing inventory. Day-level and hour-level effects exist too, but they’re small next to the seasonal wave — we cover them in the cheapest times to run Facebook ads.
Does your account itself change what you pay?
Benchmarks assume a healthy, aged, unrestricted account — and that assumption fails more often than the reports acknowledge. This is the one section where we add our own vantage point, labeled as such: Clikim operates agency ad accounts for 500+ active advertisers, so we watch identical offers run from different account infrastructures.
What we see, directionally: new accounts pay a real premium. Fresh ad accounts start with low spend caps, compressed learning, and — in our experience — noticeably worse delivery efficiency in their first weeks (the mechanics are in our warm-up guide). Post-restriction rebuilds run worse still, because trust resets harder than it builds. None of this appears in published benchmarks, whose samples skew toward established accounts.
The infrastructure implication: an advertiser bouncing between fresh accounts after restrictions is permanently paying the new-account premium — often while comparing themselves to benchmarks set by stable accounts. That gap, not the headline CPM, is frequently the real cost problem. It’s the economic case for account stability in general and, for operations that can’t afford resets, for whitelisted agency infrastructure — which is our business, so weigh the source; the published numbers above stand on their own either way.
Seven levers that actually move your costs
Benchmarks describe the market; these are the inputs that decide where in the range you land. Ordered by leverage, not novelty.
1. Creative volume and refresh. CPM inflation punishes fatigued creative twice — higher price, lower response. The accounts beating 2026 benchmarks ship more distinct concepts, not bigger budgets.
2. Conversion rate before bid strategy. A 20% CVR lift beats any bidding trick at current auction prices. Eleven of fifteen industries improved CVR in 2025 — the efficiency war moved on-site.
3. Objective honesty. Buying traffic clicks at $0.70 to chase lead outcomes produces cheap clicks and expensive leads. Pay the $1.92 for the auction that optimizes toward what you actually want.
4. Broad-plus-signal targeting. Micro-targeting in 2026 buys auction pressure, not precision. Broad audiences with strong conversion signals underrun the benchmarks above more often than any interest stack.
5. Placement breadth. Reels and newer placements still price below feed. Letting delivery arbitrage placements is one of the few remaining free discounts.
6. Frequency discipline. Past ~2.5–3 weekly frequency on cold audiences, you’re rebuying the same eyeballs at rising CPM. Cap it with structure, not hope.
7. Calendar awareness. Test in cheap windows, harvest in expensive ones. The Q4 tax is optional for everyone who doesn’t sell gifts.
How much should you budget for Facebook ads in 2026?
The 40-word answer: work backward from the benchmark cost of your outcome, and buy enough outcomes for the system to learn — roughly 50 conversions a month is the practical floor. At 2026 prices, that puts most serious accounts at $1,400–$2,000 a month minimum.
The arithmetic, using the medians above. An ecommerce brand at Triple Whale’s $38.17 median CPA needs about $1,900/month (~$63/day) to buy 50 purchases. A lead-gen business at the $27.66 median CPL needs about $1,380/month (~$46/day) for 50 leads. A legal practice at $120+ per lead is realistically a $2,400+/month program even at modest volume — which is fine, because one signed client covers the quarter.
Click math tells the same story from the other side: 1,000 visits cost about $700 at the all-industry traffic CPC, and closer to $1,370 at the ~$1.37 CPC ecommerce advertisers actually pay (Madgicx). If your site converts at 2%, that’s 20 sales per thousand visits — your CPA lands in the $35–70 band the benchmarks predict. When the numbers don’t close at your margins, the fix is conversion rate or offer, not a smaller budget.
Two adjustments to the baseline. Scaling into Q4? Add 20–30% to hold volume at holiday CPMs — that’s the seasonal tax above, priced in ahead of time instead of discovered in November. And keep a testing reserve: the accounts that beat these benchmarks treat roughly 10–20% of spend as permanent creative R&D, because in a +20%-CPM market, fresh creative is the only discount that compounds.
How do you read a benchmark report correctly?
The 40-word answer: check whose accounts are in the sample, which geography, which campaign objective, whether the number is a median or a mean, and what date window it covers. If a report won’t tell you those five things, it’s content, not data.
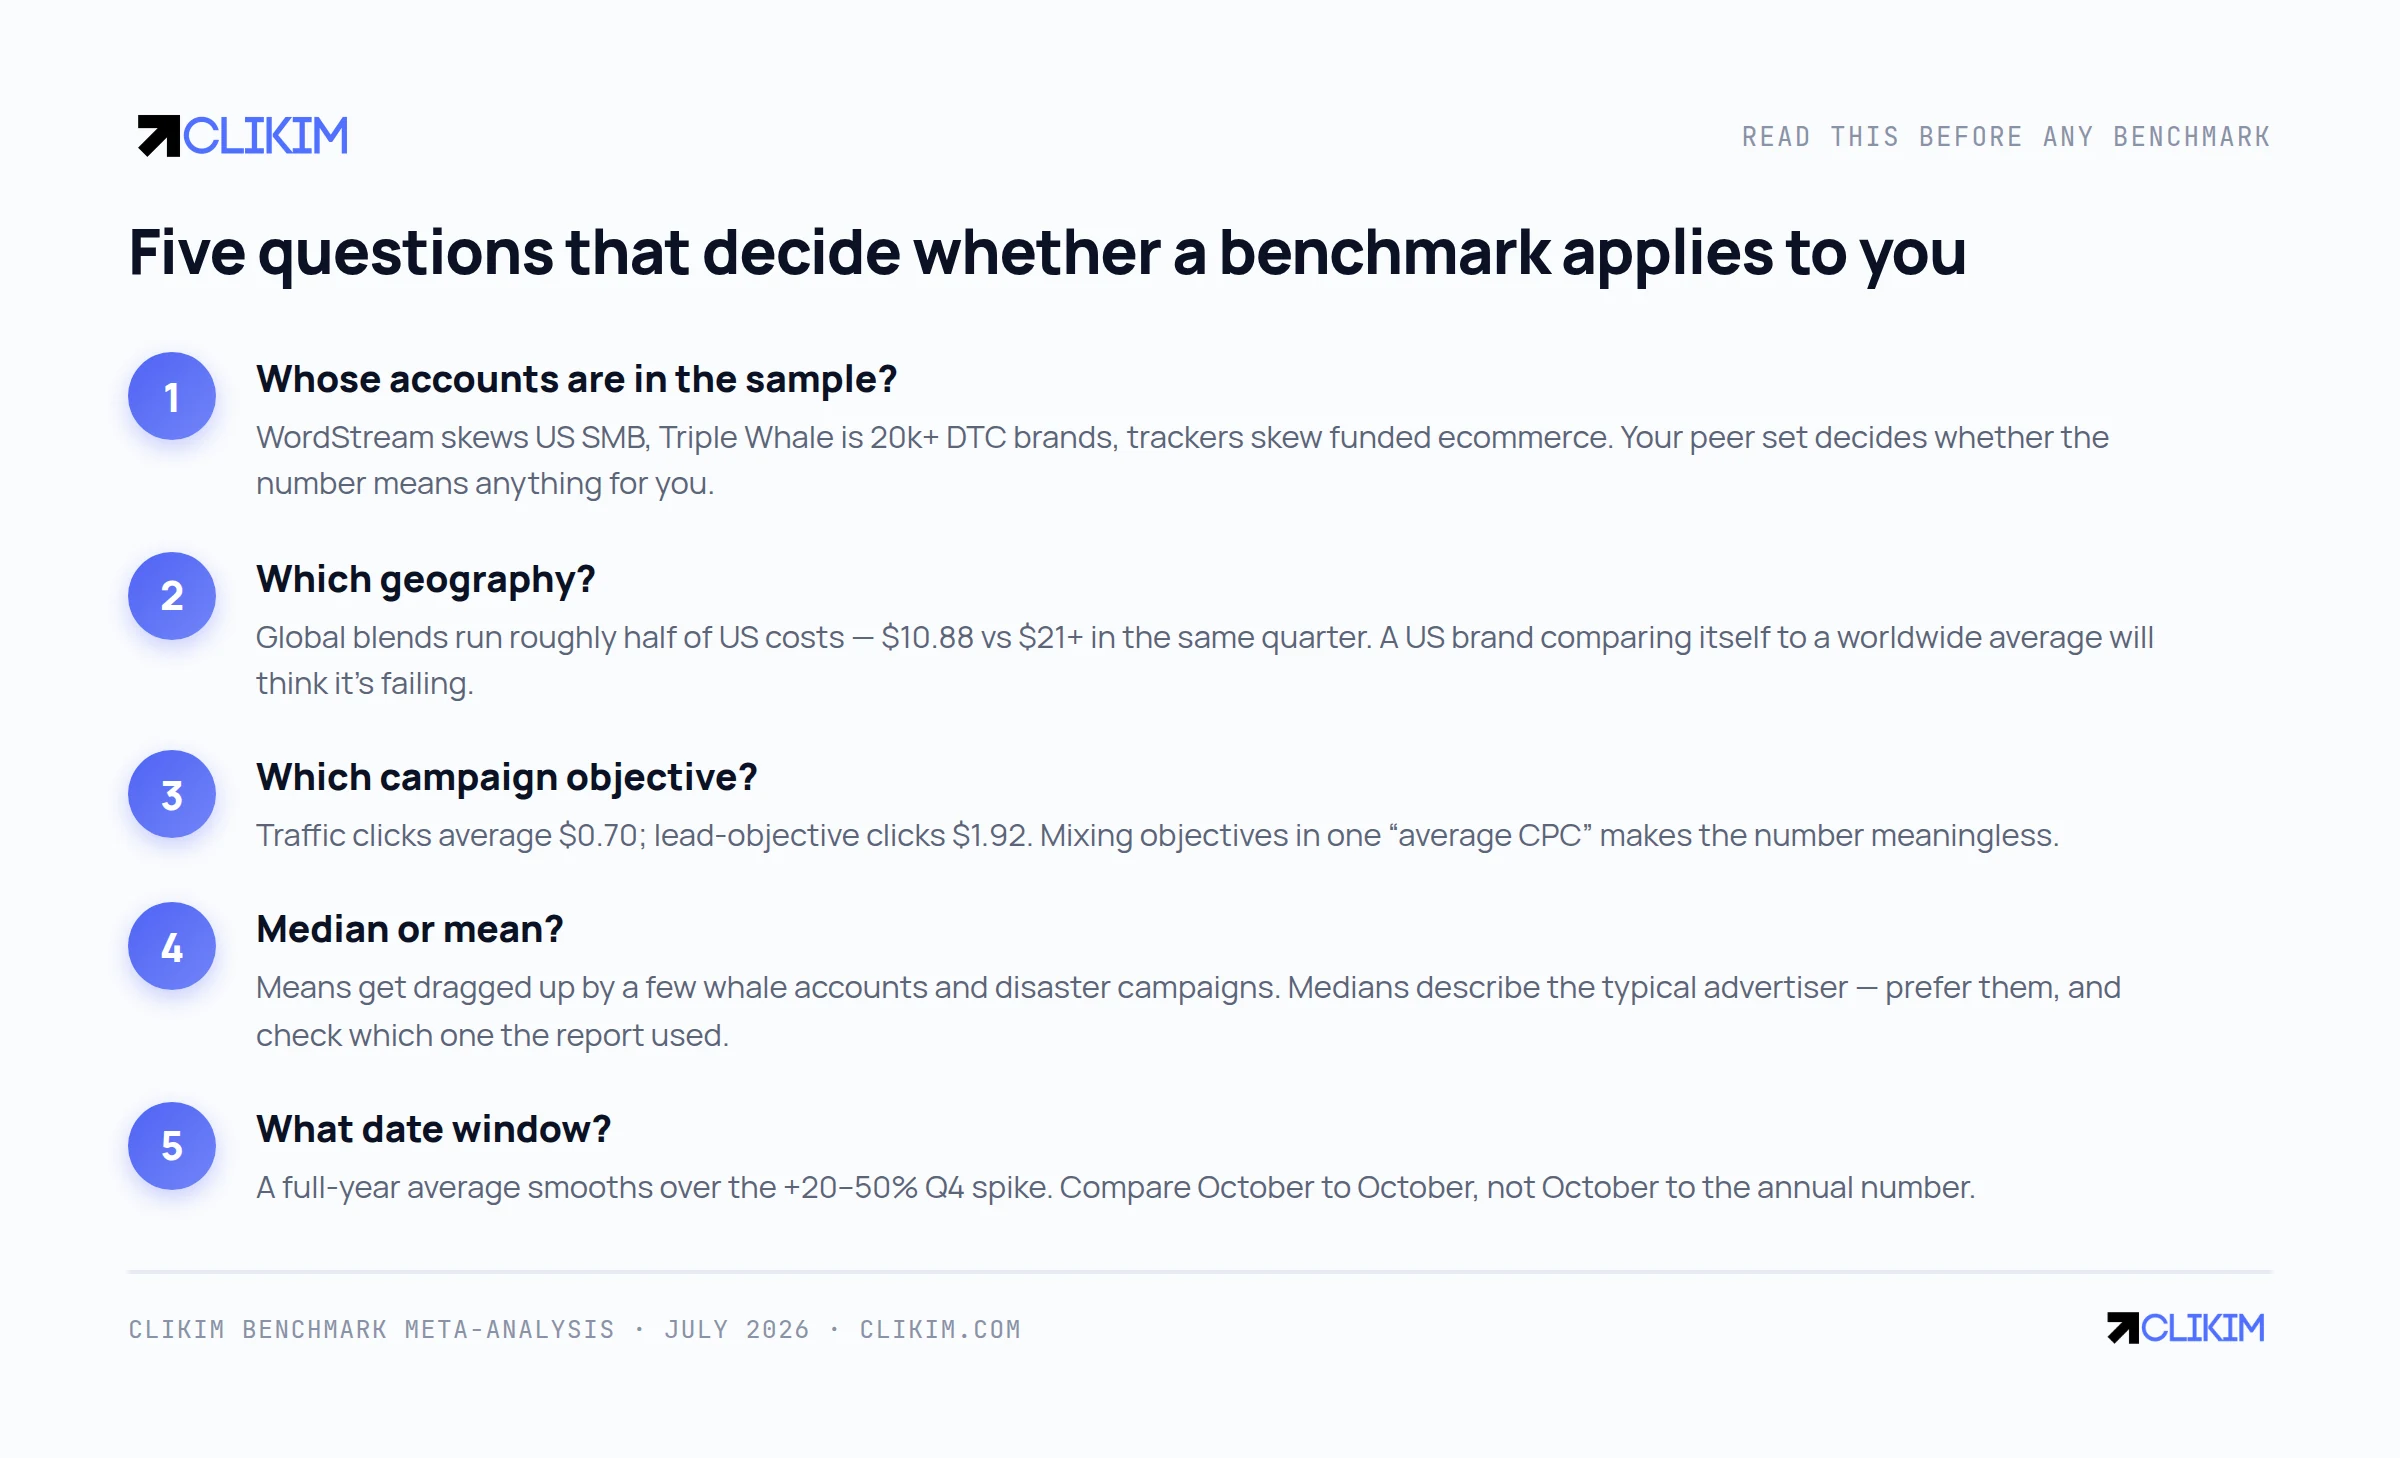
Five questions that decide whether any benchmark applies to you. Steal this checklist.
This checklist is also why we built this page as a meta-analysis instead of publishing “Clikim’s average CPM.” Our managed accounts skew toward high-spend, restricted-recovery advertisers — a biased sample by design — so a single Clikim average would mislead you exactly the way this section warns about. Curating everyone else’s published data, with the biases labeled, is the more honest artifact.
Methodology, sources and how to cite this report
Every number on this page is a published figure from a named source; nothing here is invented. Primary sources: WordStream’s 2025 Facebook Ads Benchmarks, Triple Whale’s industry benchmarks (20,000+ brands), Lebesgue’s benchmark dataset, Gupta Media’s social ads cost tracker, Birch’s three-year Meta cost analysis, Madgicx’s cost guide, and AdAmigo’s 2026 CPL benchmarks, with seasonal color from Varos, SuperAds, Billo and Strike Social.
What we did: normalized each source’s figures to common metrics, kept medians and means labeled as published, preserved each source’s geography and sample description, and refused to average across incompatible datasets — the disagreement chart exists precisely because a blended “true average” would be fiction. Where we add Clikim-side observations (the account-trust section), they are labeled directional and excluded from every chart.
Citing: quote any number or graphic with a link to this page; the infographic is licensed for reuse with credit (embed code above). This report refreshes quarterly as sources publish new data — next scheduled update: October 2026, ahead of Q4 planning. Corrections and datasets are welcome via the contact page, credited if you wish.
Frequently asked questions
How much do Facebook ads cost per click in 2026?+
What is the average Facebook CPM in 2026?+
How much does a Facebook lead cost?+
What is a good CTR for Facebook ads?+
Why did my Facebook CPM go up in 2025–2026?+
Are Facebook ads more expensive in Q4?+
What is a good ROAS for Facebook ads in 2026?+
What is the average cost per purchase on Facebook?+
Which industry pays the most for Facebook ads?+
Why do WordStream and Triple Whale report different Facebook costs?+
How much should I budget for Facebook ads as a beginner?+
Do new Facebook ad accounts pay higher costs?+
Will Facebook ad costs keep rising in 2027?+
How often is this report updated?+
Stop paying the new-account premium
Whitelisted Meta & TikTok infrastructure — stable, high-limit infrastructure so your costs track the market, not your account history.