
What's a Good Conversion Rate for Facebook Traffic?
By the time CVR is measured, the ad already succeeded — someone wanted the promise enough to click. Here are the honest benchmarks by funnel type, the five leaks that quietly halve conversions, and why a CVR fix multiplies every ad dollar at once.
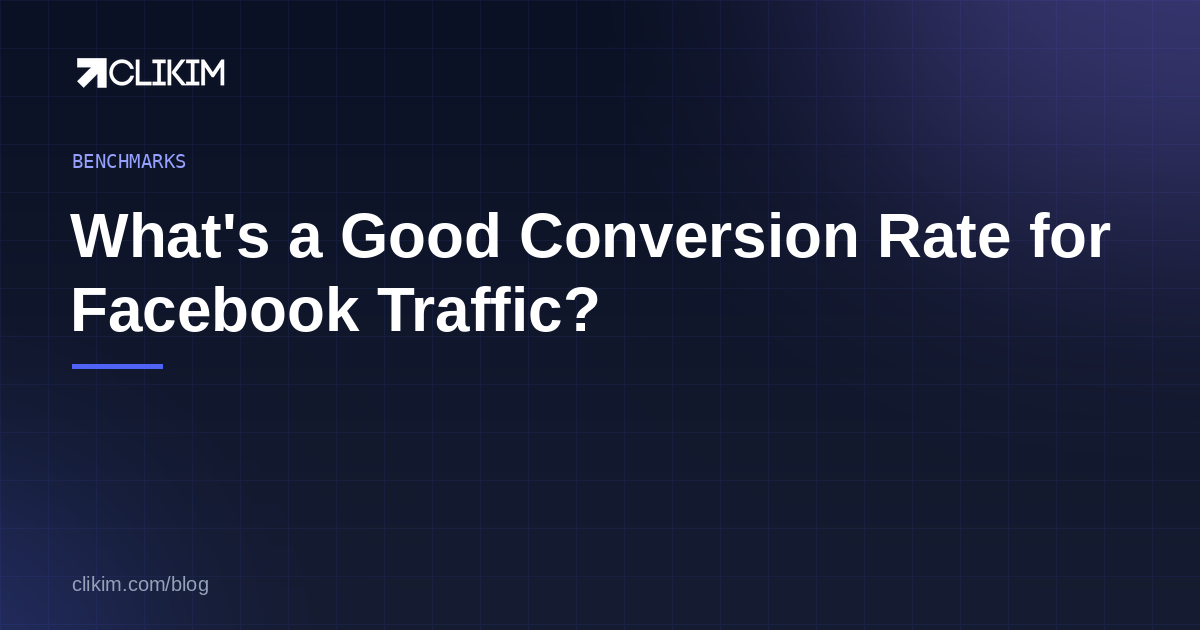
Paid-social landing traffic converts at roughly 2.5–5% for impulse ecommerce, 1.5–3% for considered purchases, 8–15% on simple lead forms and 2–6% for qualified B2B — funnel type sets the benchmark, not industry. Healthy CTR with low CVR means the leak is downstream of the click: audit speed (the cheapest win), message match, friction, and trust, in that order. Fix one leak at a time, judge on weekly cohorts segmented by traffic warmth, and verify tracking before believing any low number.
- Facebook traffic converts at 2.5–5% for impulse ecommerce, 1.5–3% considered, 8–15% on simple lead forms — funnel type sets the benchmark.
- CVR is a page-and-offer grade, not an ad grade: healthy CTR + low CVR = the leak is downstream of the click.
- The big five leaks: slow pages, message mismatch, forced accounts, surprise costs, weak trust.
- Every second of load time past ~2s costs real conversions — speed is the cheapest CVR win.
- Message match beats page polish: the page must continue the exact promise the ad made.
- Judge CVR on weekly cohorts by funnel stage, not blended dailies.
- A CVR fix multiplies every ad dollar — it’s the highest-leverage “ad optimization” that isn’t in Ads Manager.
Start with the numbers
Here's the statistical landscape in one paragraph: paid-social visitors landing on an ecommerce page convert to purchase at roughly 2.5–5% for impulse price points, 1.5–3% for considered ones, and under 2% for high-ticket. Simple lead forms convert 8–15% of their landings; qualified B2B forms, 2–6%. Anything past those ranges in either direction is telling you something — and the whole skill of using CVR benchmarks is knowing what.
Landing-view → conversion, paid social traffic, 2026 compiled medians. Your funnel type is the comparison that matters.
Two framing rules before you compare. First, these are landing-view to conversion rates for paid social traffic — colder than search traffic, warmer than display; comparing your Facebook CVR to your Google brand-search CVR is a category error. Second, per our benchmarks guide: the ranges locate you once, and after that your own trailing 30 days is the benchmark that steers.
CVR grades the page, not the ad
The single most useful mental model: by the time CVR is measured, the ad has already succeeded. Someone saw it, wanted the promise, and paid a click of attention. Low CVR with healthy CTR means the handoff failed — the page loaded slowly, broke the promise, added friction, or failed to close. That's why the kill-rules framework is emphatic: killing ads for CVR problems destroys working creative to punish an innocent party.
The exception worth checking: intent mismatch, where the ad wins clicks with a promise the product can't cash ("free" hooks for a paid product, curiosity-bait). CTR looks great, CVR craters, and the ad is guilty — of overpromising. Honest hooks that pre-qualify, per our creative playbook, cost some CTR and repay it in CVR.
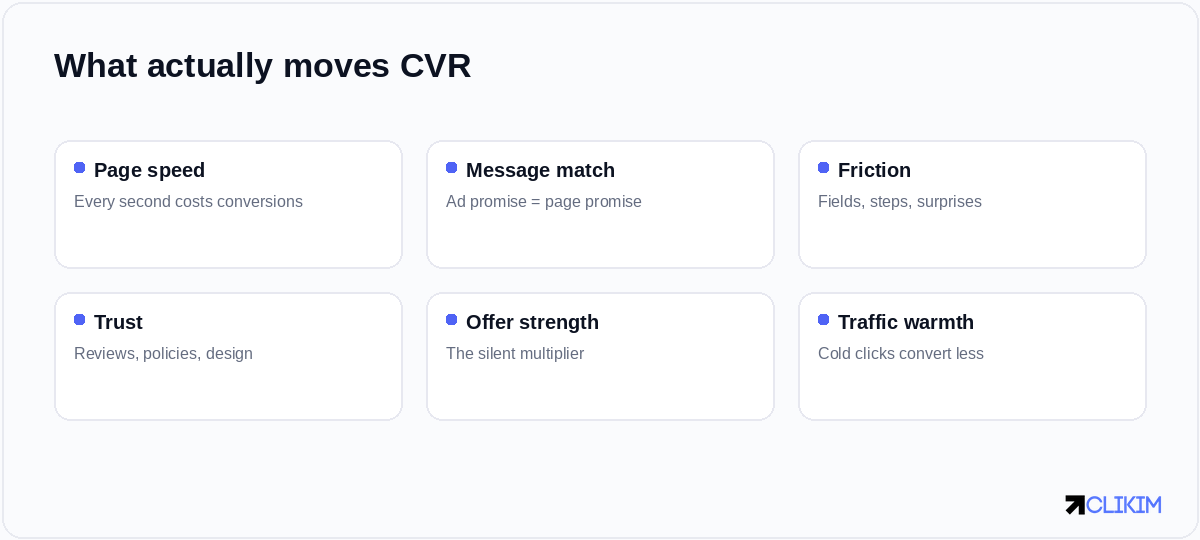
Six levers move conversion rate — and only one of them lives inside Ads Manager.
The big five leaks (with damage estimates)
Stack three leaks and half your conversions are gone before the offer gets a vote.
Speed leads for a reason: mobile paid-social traffic is the most impatient audience on the internet, and conversion probability decays measurably with every second past two. Run your landing URL through Google’s PageSpeed Insights before touching anything else — it’s free, brutal, and usually finds the cheapest CVR win on the list.
Message match is the subtler giant: an ad promising “the $29 starter kit” must land on the $29 starter kit — not the homepage, not the category. Accounts running one landing page per creative angle consistently out-convert accounts funneling every ad to one generic page.
Why CVR is the multiplier that matters
Same ads, same clicks — CVR is the multiplier that decides whether the whole machine is profitable.
Run the table's arithmetic on your own numbers and the priority usually reorders itself: a CVR improvement from 1.2% to 2.8% more than halves CPA across every campaign, every ad set, every creative — simultaneously. No bid strategy, budget structure, or targeting change in this entire series moves the blended number that hard. The landing page is an ads lever that happens to live outside Ads Manager.
Device and placement change the number too
Two more segmentation lines before you panic over a blended figure:
- Device — desktop paid-social traffic routinely converts 1.5–2× mobile on the same store: bigger screens, easier checkout, more deliberate browsing context. Since Facebook delivery skews heavily mobile, your blended CVR is mostly a mobile grade.
- Placement — Stories and Reels clicks arrive from the most impulsive context and convert below Feed clicks; Audience Network traffic converts worst of all and is worth breaking out before it drags your read of everything else.
Why is my mobile conversion rate so much lower than desktop?
A 1.5–2× desktop advantage is normal — bigger screens, easier checkout. Beyond ~2×, you have a mobile experience problem: slow load, cramped forms, or a desktop design squeezed onto a phone. Since Facebook traffic skews mobile, that gap dominates your blended number.
The operating habit: keep a simple CVR grid — funnel stage × device — refreshed monthly. Ten minutes of segmentation converts most CVR mysteries into obvious, boring explanations.
Improving CVR like you test ads
The same testing discipline that governs creative applies to the page: one variable, fair traffic, pre-committed judgment windows. The leverage hierarchy on pages mirrors the ad-side one — offer framing (bundles, guarantees, price anchoring) swings hardest, then above-the-fold clarity (headline + image + one action), then friction mechanics (form fields, checkout steps), then trust dressing, and cosmetics last. Test in that order and each win compounds into every campaign at once.
If your volume can't feed a proper split test (roughly 100+ conversions per variant for a trustworthy read), don't fake it with underpowered A/Bs — make the biggest-leverage fix outright, judge on before/after weekly cohorts, and keep moving. An honest sequential improvement beats a statistically theatrical tie.
Adjust for traffic warmth
One benchmark trap specific to paid social: CVR varies with audience temperature, so blended numbers mislead. Cold broad prospecting might convert at 1.8% while retargeting runs 6–9% on the same store — both healthy for their stage.
Read CVR segmented by funnel stage (and remember attribution lag makes daily reads premature; weekly cohorts or nothing). A “CVR drop” that coincides with a prospecting budget increase is usually just mix shift — more cold traffic in the blend, converting at cold-traffic rates.
The diagnostic sequence
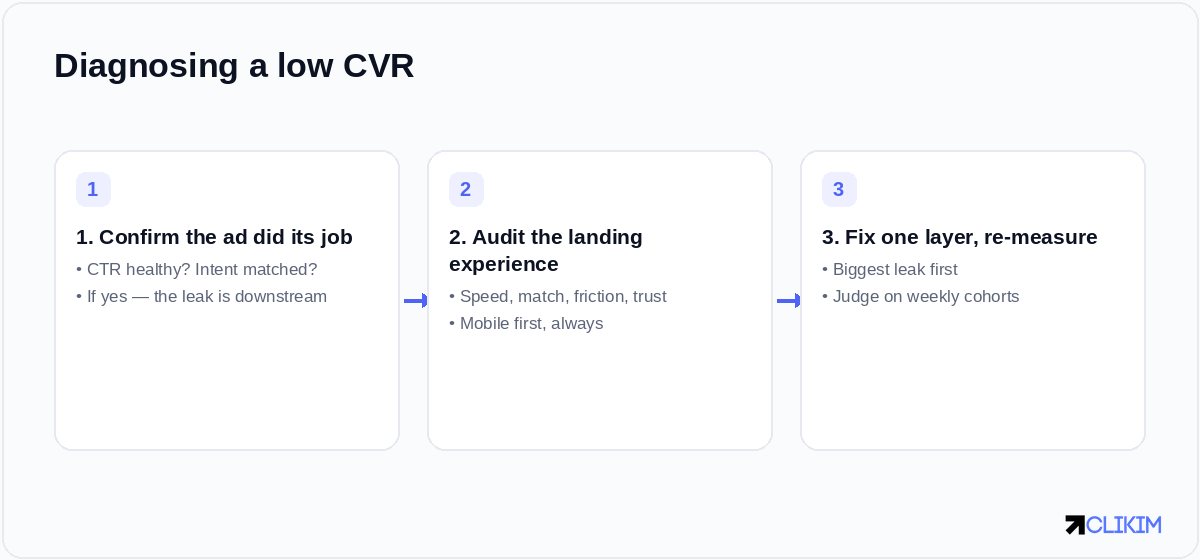
Ad's job done? Then audit the landing experience — speed, match, friction, trust — and fix the biggest leak first.
When CVR trails your funnel-type benchmark:
- Confirm the ad did its job — CTR healthy, promise honest, audience sane.
- Audit the landing experience in order of damage — speed on mobile, message match against the actual ad, friction count (fields, steps, surprises), trust surface (reviews, policies, design coherence).
- Fix the single biggest leak, then re-measure on a weekly cohort before touching the next.
Shotgun page redesigns are the landing-page version of shotgun campaign edits — you’ll never know what worked.
Can bad tracking look like a bad conversion rate?
Yes — an undercounting pixel manufactures “low CVR” out of missing data. If Meta’s counts trail your store beyond attribution differences, fix pixel + Conversions API deduplication before touching the page.
And verify the measurement itself before any of it: an undercounting pixel manufactures low CVR out of thin air. If Meta's purchase count trails your store's by more than attribution explains, fix tracking first — you may discover your "conversion problem" was an accounting problem.
The sequel metric: conversion quality
For lead gen especially, CVR has a sequel that decides whether the benchmark meant anything: what the conversions are worth.
A form converting at 14% with leads that never answer the phone is worse business than one converting at 6% with buyers — and the tactics that inflate CVR (prefilled instant forms, giveaway hooks, minimal qualification) are frequently the ones that degrade quality. The honest scoreboard pairs CVR with a downstream rate: lead-to-qualified, trial-to-paid, or first-to-second purchase for ecommerce.
Practical version: add one qualifying step when quality lags (a phone field, a budget dropdown, an extra confirmation) and accept the CVR haircut it causes — you're trading vanity conversions for revenue. The reverse also holds: if quality is strong and volume starved, strip a field and let CVR climb. The dial goes both ways; most funnels have never consciously set it.
One more sequel worth tracking for ecommerce: post-conversion behavior. A CVR "win" that ships more first orders but craters repeat rate (aggressive discount pages tend to do this) optimized the metric against the business. Monthly cohort revenue per visitor — not CVR alone — is the number that catches it.
The compounding version
One caution as you finish: benchmark obsession has a failure mode of its own. Teams that chase the “strong” column of every table end up optimizing five metrics against each other — clipping CTR for CVR, CVR for AOV, AOV for volume — while the only number that pays anyone, blended cost per acquired customer against lifetime value, drifts unattended.
Use this page the way it was written: locate yourself once, fix the leaks that are objectively broken, and then let unit economics arbitrate every trade-off the tables can’t see.
CVR work compounds with everything else in this series: better conversion rates feed more signal to the learning phase, which sharpens delivery, which improves traffic quality, which lifts CVR again. The accounts that ride that loop hardest are the ones spending enough to turn it — which circles back, as always, to headroom: a capped account runs the loop in miniature, while an uncapped agency account lets a fixed funnel compound at full speed.
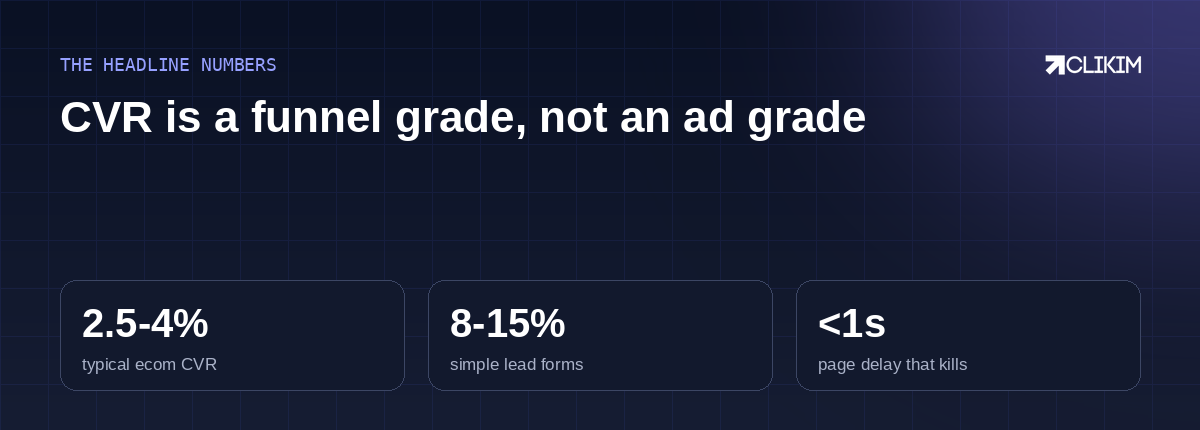
The funnel grade: fix the page once, and every ad dollar you ever spend converts better.
the Meta-vs-Shopify mismatch — why the two dashboards never agree, decoded. Meta vs GA4 — three different jobs, three different clocks.
Frequently asked questions
What is a good conversion rate for Facebook ads traffic?+
Why is my Facebook traffic not converting?+
Does a low conversion rate mean my ads are bad?+
How much does page speed affect conversion rate?+
What is message match?+
Should prospecting and retargeting have the same CVR?+
How do I diagnose a conversion rate drop?+
How does CVR affect my CPA?+
What tools check landing page speed?+
Should I optimize for conversion rate or conversion quality?+
Fix the funnel, then feed it
A converting page deserves traffic without a ceiling. Managed whitelisted infrastructure keeps the compounding loop running at full speed. Operated on BM2500 infrastructure.