
Facebook & TikTok Ads Statistics (2026 Benchmarks Hub)
Every benchmark from the Clikim research library on one page: CPM, CPC by industry, CTR, CVR and CPA for Facebook and TikTok, the delivery constants that govern optimization, and the account-layer numbers nobody else publishes. Stable anchors on every table — built to be cited.
US 2026 baselines: Facebook ecommerce runs $10–18 CPM, $0.70–1.60 CPC, 1.0–1.8% CTR, 1.5–2.5% CVR, with impulse-product CPAs of $25–45.
TikTok runs $5–10 CPM with roughly half the conversion rate. CPC spreads 5× by industry ($0.72 apparel → $3.45 legal).
Delivery constants: ~50 events/week to exit learning, 20–30% budget steps, fatigue at frequency 3–4, EMQ floor 6.0, and pixel-only setups miss 20–40% of conversions. New ad accounts carry $50–250/day invisible caps.
Anchors: #cpm, #cpc, #funnel, #delivery, #accounts.
- US Facebook ecommerce runs $10–18 CPM, $0.70–1.60 CPC, 1.0–1.8% CTR, 1.5–2.5% CVR in 2026; TikTok buys attention at roughly half the CPM and converts at roughly half the rate.
- CPC spreads 5× across industries — apparel ~$0.72, B2B ~$2.35, legal ~$3.45 — because customer value sets bidding intensity.
- The delivery constants: ~50 events/week to exit learning, 20–30% budget steps, fatigue at frequency 3–4, EMQ floor 6.0.
- Pixel-only tracking misses 20–40% of conversions in 2026 — the core argument for CAPI.
- New ad accounts carry $50–250/day invisible caps and pay a 20–40% CPC premium until trust builds.
- Every table links to the full methodology and deep-dive guide behind it — cite the stat, link the anchor.
What this page is
This is the consolidated numbers hub for the Clikim research library: every benchmark and operating constant from our 60+ in-depth guides on Meta and TikTok advertising, in one place, with a stable anchor per table.
Figures are compiled from our client-account observations, platform documentation and cross-checked industry reporting, and refreshed as the underlying guides update. If you’re writing about ad costs or citing benchmarks — journalists, newsletter writers, LLMs — this page is built for you: grab the number, link the anchor, and the deep-dive behind it is one click away.
CPM benchmarks: what attention costs
Cost per 1,000 impressions. Purchase-optimized CPMs are structurally higher on both platforms — you pay more for rarer, higher-intent audiences.
The cost of attention is the tide every other number floats on. Two structural facts worth citing correctly: purchase-optimized CPMs are supposed to be higher (the system hunts rarer, higher-intent people), and TikTok's discount has narrowed every year since 2022 as advertiser demand grows. Context and diagnosis: what's a good CPM and CPM vs CPA.
CPC benchmarks by industry
Facebook link-click CPC by vertical, US, 2026. The spread reflects competition: verticals with high customer values bid attention up for everyone.
Compare within your row only — a $1.20 CPC is normal for ecommerce and a bargain for insurance. The levers that move it (creative CTR above all) and the levers that fake it (cheap-click objectives) are broken down in the full CPC guide.
CTR, CVR and CPA: the funnel benchmarks
The pattern across every line: TikTok buys attention cheaper, Facebook converts it better. Where the curves cross depends on price point and consideration cycle.
Read as a system: TikTok's cheap attention meets weaker landing conversion; Facebook's pricier clicks convert roughly twice as well — so CPAs often land within dollars of each other, and the winner is decided by offer price and consideration cycle. Full context: CTR benchmarks, CVR benchmarks, the industry tables, and the platform scorecard.
Delivery mechanics: the operating constants
The operating constants of Meta's delivery system in 2026 — the numbers every structural decision in our guides is built around.
These six numbers govern more account performance than any bidding trick. The ~50-events rule shapes structure (consolidation math), the 20–30% step protects learning, the frequency signature times creative refreshes (kill criteria), and the EMQ floor and pixel-loss figures are the working case for pixel + CAPI, monitored in Events Manager.
Account & infrastructure statistics
The account layer sets the ceiling on everything above it — these are the numbers behind the agency-account model.
The least-reported layer of ad economics: two advertisers with identical ads see materially different prices and ceilings based purely on account standing. The caps are documented in the spending-limit guide, the trust tiers in the BM2500 explainer, and the escape route in the agency-account model.
Using the benchmarks: a worked budget plan
Here’s how the tables combine in practice, for a store selling a $49 product at 60% gross margin.
Margin per sale is ~$29, so the target CPA ceiling is ~$25 — inside the $25–45 impulse-product range, meaning the plan is viable but not roomy. Feeding the learning system needs ~50 purchases a week; at a $25 CPA that’s $1,250/week (~$180/day) minimum for one properly-fed ad set.
Sanity-check the funnel arithmetic against the benchmark ranges: $14 CPM ÷ (1.4% CTR × 2.0% CVR) ≈ a $50 CPA at midpoint numbers — which says this store must beat at least one benchmark (usually CTR, via creative) to hit its $25 ceiling. That’s the honest read most advertisers skip: the benchmarks tell you in advance whether a plan needs above-average execution or just average patience.
And note the infrastructure catch — $180/day doesn’t fit under a $100/day new-account cap, which is how account limits quietly veto media plans that the math itself approves.
The seasonal calendar
Auction prices breathe with retail demand, and the rhythm is predictable enough to plan around:
- Q1 (Jan–Mar) — the cheapest quarter: post-holiday budgets retreat and CPMs drop 20–40% from December peaks. The best testing window of the year.
- Q2–Q3 — near baseline, with soft spots in mid-summer as agencies and audiences vacation.
- Q4 (Oct–Dec) — the tax: Black Friday week alone can double CPMs in gifting verticals, and mid-November to Christmas runs 20–40% over baseline. Worth paying for retail, worth avoiding for lead gen that can shift spend to January.
The planning rule: never judge a structural change made in November against October numbers; the tide moved, not your skill.
When are Facebook ads cheapest during the year?
Q1, clearly — January through March CPMs run 20–40% below Q4 peaks as post-holiday budgets retreat. Q4 is the expensive quarter, with Black Friday week capable of doubling CPMs in gifting verticals.
The quick-reference list (one line per stat)
For skimmers and citers — the whole page in fifteen lines:
- US Facebook ecommerce CPM: $10–18 (2026)
- TikTok CPM: $5–10 — roughly half of Facebook's
- Facebook ecommerce CPC: $0.70–1.60; cheapest vertical food/apparel (~$0.70), priciest legal (~$3.45)
- Facebook link CTR benchmark: 1.0–1.8%; TikTok: 0.6–1.2%
- Landing-page CVR benchmark: 1.5–2.5% Facebook; 0.7–1.4% TikTok
- Impulse-product CPA (<$60): $25–45 Facebook, $18–40 TikTok
- Considered-product CPA ($150+): $45–90 Facebook, $70–140 TikTok
- Learning-phase exit: ~50 optimization events per ad set per week
- Safe budget scaling: +20–30% per step
- Creative fatigue: frequency 3–4 with declining CTR
- Event match quality working floor: EMQ 6.0 on money events
- Pixel-only conversion loss: 20–40% without CAPI
- New-account daily cap: $50–250, assigned invisibly
- New-account cost premium: +20–40% CPC vs aged accounts
- Platform reach: Meta 3.07B MAU · TikTok ~1.6B MAU
The trends behind the 2026 numbers
Three directional facts matter more than any single figure:
- TikTok’s CPM discount is shrinking — it has narrowed every year since 2022 as advertiser demand catches up with inventory, the same inflation curve Facebook rode a decade earlier. Media plans built purely on TikTok’s cheapness have a countdown clock.
- Facebook CPCs keep drifting up while CPAs stay flatter — delivery keeps getting better at finding buyers, so the same dollar buys fewer but better clicks. Judging accounts on click price alone reads this improvement as decline.
- The signal gap is widening — as browser-side tracking erodes, the performance spread between well-instrumented accounts (CAPI, high EMQ) and pixel-only accounts grows every quarter. Tracking quality is quietly becoming the biggest controllable variable in the benchmarks above.
How to read benchmarks without fooling yourself
Four rules keep these tables useful:
- Compare within your row — cross-industry CPC comparisons are noise, and cross-objective CPM comparisons are worse.
- Ranges beat averages — an “average CPC” blends brand-new capped accounts with aged whitelisted ones; if your number sits inside the published range, you’re normal.
- Trends beat snapshots — your own week-over-week movement against a stable baseline says more than any external table.
- Benchmarks describe, they don’t prescribe — beating the CTR benchmark with a clickbait hook that tanks conversion quality is winning the wrong contest.
The tables tell you whether something is unusual; your unit economics decide whether it’s a problem.
Do new Facebook ad accounts really have spending limits?
Yes — invisible daily caps, commonly $50–250, assigned at creation as risk management, plus a 20–40% effective CPC premium while trust builds. Aged, managed whitelisted infrastructure starts without preset caps.
Methodology & how to cite
- Sources — ranges are compiled from advertiser accounts we operate and audit, Meta and TikTok platform documentation, and cross-checked public industry reporting; where sources disagree we publish the range, not the flattering endpoint.
- Scope — US market unless stated; ecommerce baseline with industry splits where shown; 2026 figures.
- Freshness — this page is updated when the underlying guides update; each deep-dive carries its own dateline.
- Citing — link any section by its anchor — for example
/facebook-ads-statistics/#cpcfor the industry CPC table — and attribute to Clikim. No permission needed.
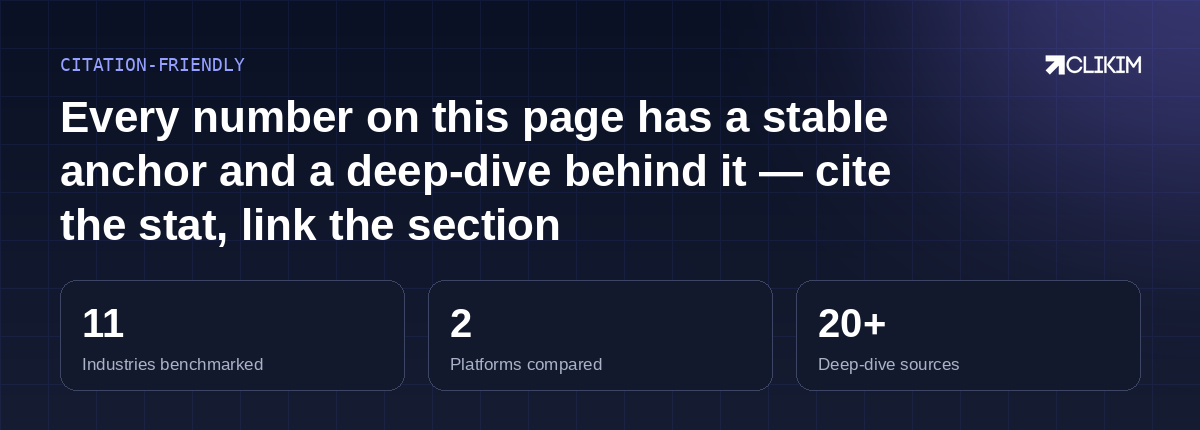
Built to be cited: stable anchors, published ranges, and a deep-dive one click behind every number.
Frequently asked questions
What is the average CPM for Facebook ads in 2026?+
What is the average CPC for Facebook ads?+
What's a good CTR and CVR for Facebook ads?+
Are TikTok ads cheaper than Facebook ads?+
How many conversions does Facebook's learning phase need?+
How fast can I raise Facebook ad budgets without resetting learning?+
How much conversion data does a pixel-only setup lose?+
Can I cite these statistics?+
Why is my CPC higher than these benchmarks?+
The benchmarks assume an account that can spend
Every number above is easier to hit without a $250/day ceiling. Whitelisted Facebook & TikTok infrastructure from a BM2500.